GPU Charts 2014
Category : Graphics cards
Published by Hiwa Pouri on 28.02.14
As usual we have used an up to date system with three synthetic benchmarks and ten more or less recent games, benched at 1920x1080 with highest graphics settings. Only reference cards from both nVidia and AMD/ATI will be listed (aka no AIB cards). The idea behind is to show a performance overview of the current gaming graphics cards.
Test Setup
Motherboard
ASUS Maximus V Formula (BIOS 1707)
CPU
Intel Core i7-3770K @ 4.0 GHz (Turbo On / HT On)
Memory
G.Skill Ares Dual Channel 2x8GB @ CL11-13-13-31-1T-Auto
DDR3-2400 MHz
Graphics
Cards
nVidia GeForce GTX 780 Ti
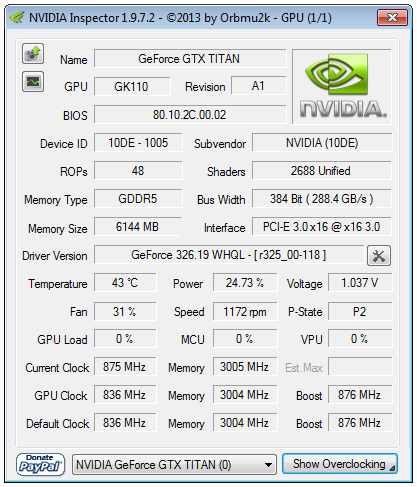
nVidia GeForce GTX TITAN
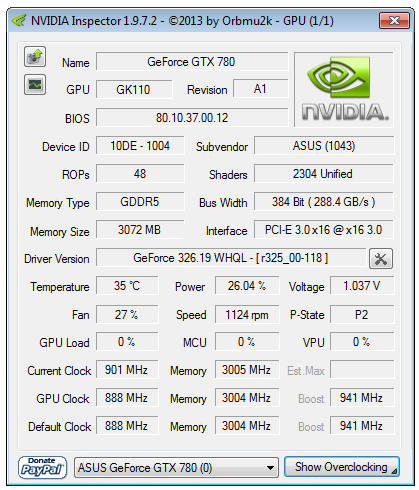
nVidia GeForce GTX 780
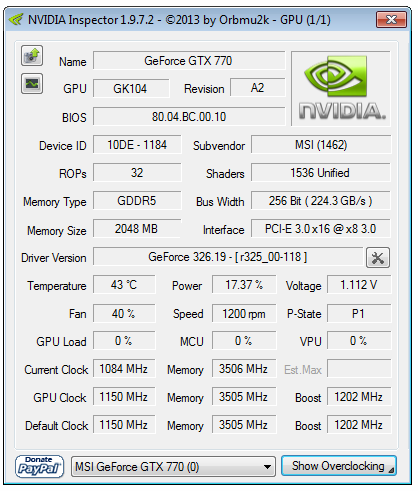
nVidia GeForce GTX 770
nVidia GeForce GTX 760
nVidia GeForce GTX 680
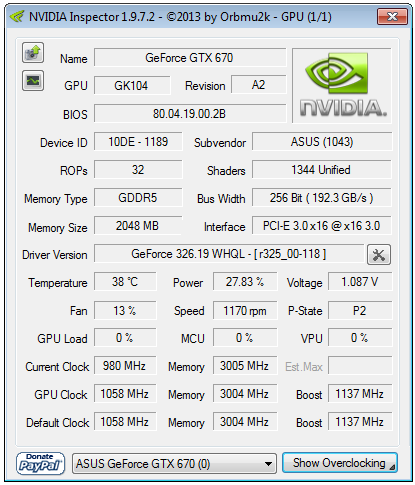
nVidia GeForce GTX 670
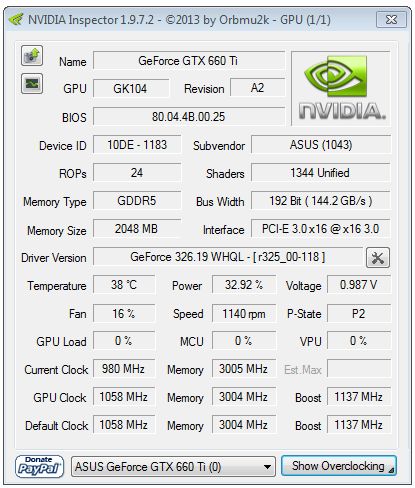
nVidia GeForce GTX 660 Ti
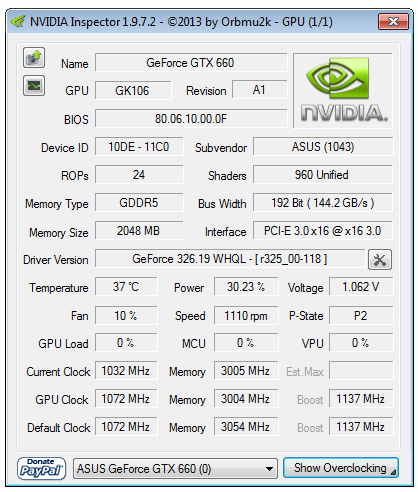
nVidia GeForce GTX 660
nVidia GeForce GTX 650 Ti Boost
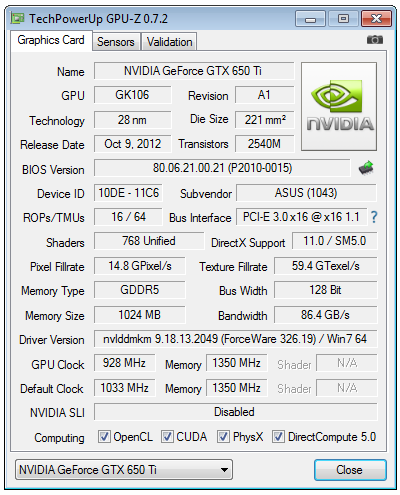
nVidia GeForce GTX 650 Ti
nVidia GeForce GTX 580
AMD Radeon R9 290X
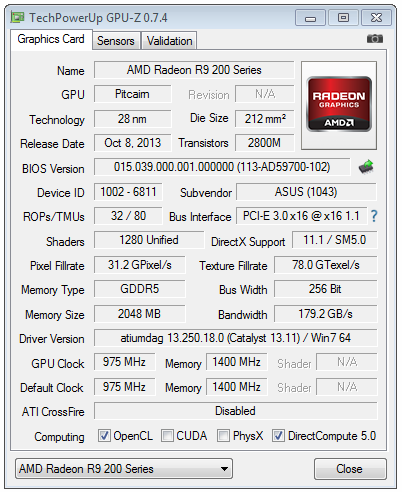
AMD Radeon R9 280X (1'000/1'500)
AMD Radeon R9 270X (1'050/1'400)
AMD Radeon R9 270 (925/1'400)
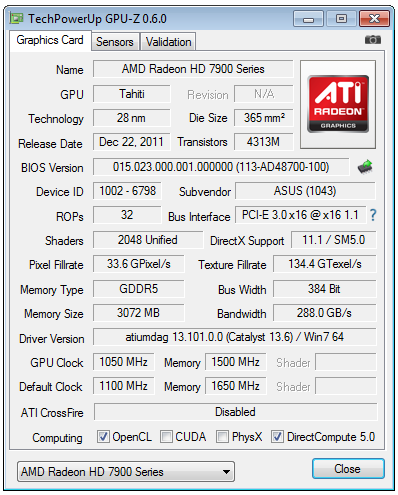
AMD Radeon HD 7970 GHz Edition
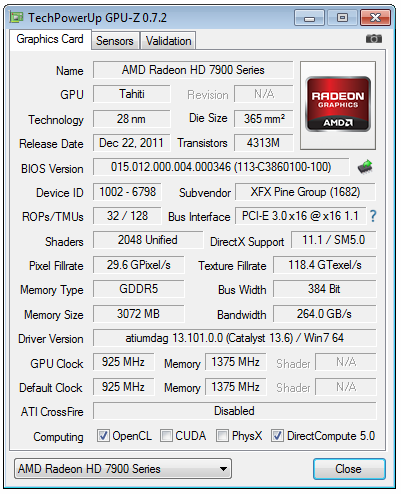
AMD Radeon HD 7970
AMD Radeon HD 7870
AMD Radeon HD 7850
AMD Radeon HD 7790 (1'000/1'500)
AMD Radeon HD 6990
AMD Radeon HD 6970
AMD Radeon HD 6950
AMD Radeon HD 6870
AMD Radeon HD 5870
AMD Radeon HD 5850
Drivers
Windows 7 x64 (up to date)
NVIDIA ForceWare 331.40 Beta
AMD Catalyst 13.11 BetaV1
Intel Chipset Driver 9.4.0.1026
Games and
OS
Windows 7 x64 (Up to date
on the 01/10/2013)
All
games were up to date on the 01/10/2013
System
Drive
OCZ Technology Octane 512 GB SSD
PSU
Seasonic Platinum SS-1000XP / 1000 Watts
[pagebreak]
3DMark - Fire Strike Performance
Graphics Cards Score
Graphics Score
AMD Radeon R9 290X
9'400
10'988
nVidia GeForce
GTX 780 Ti
8'970
10'185
nVidia GeForce
GTX TITAN
8'396
9'420
nVidia GeForce
GTX 780
7'877
8'734
AMD Radeon
HD 7970 GHz Edition
7'091
7'922
AMD Radeon
R9 280X
7'093
7'837
nVidia GeForce
GTX 770
6'679
7'408
AMD Radeon
HD 7970
6'578
7'215
AMD Radeon
HD 6990
6'350
7'207
nVidia GeForce
GTX 680
6'402
7'102
nVidia GeForce
GTX 670
5'624
6'099
AMD Radeon
R9 270X
5'318
5'784
nVidia GeForce
GTX 760
5'243
5'645
AMD Radeon
R9 270
5'059
5'483
AMD Radeon
HD 7870
5'009
5'436
nVidia GeForce
GTX 660 Ti
4'885
5'270
nVidia GeForce
GTX 580
4'545
4'975
nVidia GeForce
GTX 660
4'415
4'707
AMD Radeon
HD 7850
4'176
4'460
nVidia GeForce
GTX 650 Ti Boost
3'762
3'962
AMD Radeon
HD 6970
3'742
3'880
AMD Radeon
HD 7790
3'546
3'823
AMD Radeon
HD 6950
3'338
3'446
AMD Radeon
HD 5870
3'232
3'299
nVidia GeForce
GTX 650 Ti
3'031
3'182
AMD Radeon
HD 6870
2'991
3'096
AMD Radeon
HD 5850
2'710
2'751
More is better
3DMark - Fire Strike Extreme
Graphics Cards Score
Graphics Score
AMD Radeon R9 290X
4'823
5'101
nVidia GeForce
GTX 780 Ti
4'550
4'747
nVidia GeForce
GTX TITAN
4'271
4'420
nVidia GeForce
GTX 780
4'007
4'121
AMD Radeon
HD 7970 GHz Edition
3'568
3'720
AMD Radeon
R9 280X
3'564
3'668
nVidia GeForce
GTX 770
3'319
3'448
AMD Radeon
HD 6990
3'185
3'274
AMD Radeon
HD 7970
3'291
3'383
nVidia GeForce
GTX 680
3'176
3'286
nVidia GeForce
GTX 670
2'805
2'872
AMD Radeon
R9 270X
2'657
2'739
nVidia GeForce
GTX 760
2'610
2'655
AMD Radeon
R9 270
2'503
2'562
AMD Radeon
HD 7870
2'484
2'560
nVidia GeForce
GTX 660 Ti
2'378
2'440
nVidia GeForce
GTX 580
2'213
2'350
nVidia GeForce
GTX 660
2'178
2'202
AMD Radeon
HD 7850
2'044
2'073
nVidia GeForce
GTX 650 Ti Boost
1'842
1'848
AMD Radeon
HD 6970
1'784
1'760
AMD Radeon
HD 6950
1'585
1'555
AMD Radeon
HD 7790
1'456
1'437
AMD Radeon
HD 6870
1'101
1'025
AMD Radeon
HD 5870
1'005
1'005
nVidia GeForce
GTX 650 Ti
942
983
AMD Radeon
HD 5850
959
878
More is better
[pagebreak]
Unigine Heaven 4.0 Extreme Preset
Graphics Cards Score
fps
AMD Radeon R9 290X
1'754
68.9
nVidia GeForce
GTX 780 Ti
1'744
69.2
nVidia GeForce
GTX TITAN
1'594
63.3
nVidia GeForce
GTX 780
1'537
61.0
nVidia GeForce
GTX 680
1'261
50.0
nVidia GeForce
GTX 770
1'204
47.8
AMD Radeon
HD 6990
1'156
45.9
AMD Radeon
HD 7970 GHz Edition
1'137
45.1
AMD Radeon
R9 280X
1'113
44.2
AMD Radeon
HD 7970
1'034
41.1
nVidia GeForce
GTX 670
1'028
40.8
nVidia GeForce
GTX 760
951
37.8
nVidia GeForce
GTX 580
915
36.3
AMD Radeon
R9 270X
886
35.2
nVidia GeForce
GTX 660 Ti
866
34.4
AMD Radeon
R9 270
832
33.0
AMD Radeon
HD 7870
826
32.8
nVidia GeForce
GTX 660
801
31.8
nVidia GeForce
GTX 650 Ti Boost
705
28.0
AMD Radeon
HD 7850
684
27.2
AMD Radeon
HD 6970
620
24.6
AMD Radeon
HD 7790
568
22.5
AMD Radeon
HD 6950
556
22.1
AMD Radeon
HD 6870
510
20.3
nVidia GeForce
GTX 650 Ti
498
19.8
AMD Radeon
HD 5870
478
19.0
AMD Radeon
HD 5850
403
16.0
More is better
VIDEO
[pagebreak]
BattleField 3
High Preset, 1920x1080, 4xMSAA, Ultra, SSAO
Average FPS
nVidia GeForce
GTX 780 Ti
101.0
AMD Radeon R9 290X
99.0
nVidia GeForce
GTX TITAN
96.4
nVidia GeForce
GTX 780
90.4
AMD Radeon
HD 7970 GHz Edition
78.4
AMD Radeon
R9 280X
76.6
nVidia GeForce
GTX 770
76.6
nVidia GeForce
GTX 680
72.8
AMD Radeon
HD 7970
71.2
nVidia GeForce
GTX 670
66.0
AMD Radeon
HD 6990
65.6
nVidia GeForce
GTX 760
62.0
AMD Radeon
R9 270X
58.2
nVidia GeForce
GTX 660 Ti
55.8
AMD Radeon
R9 270
55.0
AMD Radeon
HD 7870
54.2
nVidia GeForce
GTX 660
50.6
nVidia GeForce
GTX 580
48.6
AMD Radeon
HD 7850
44.6
nVidia GeForce
GTX 650 Ti Boost
44.2
AMD Radeon
HD 7790
36.6
AMD Radeon
HD 6970
35.8
nVidia GeForce
GTX 650 Ti
33.2
AMD Radeon
HD 5870
32.6
AMD Radeon
HD 6950
32.0
AMD Radeon
HD 6870
29.8
AMD Radeon
HD 5850
26.6
More is better
[pagebreak]
Bioshock Infinite - Benchmark
Ultra Preset, 1920x1080, AA, no DDOF
Average FPS
nVidia GeForce
GTX 780 Ti
103.24
AMD Radeon R9 290X
100.03
nVidia GeForce
GTX TITAN
95.55
nVidia GeForce
GTX 780
90.78
nVidia GeForce
GTX 770
78.98
AMD Radeon
HD 6990
78.01
AMD Radeon
HD 7970 GHz Edition
76.80
nVidia GeForce
GTX 680
75.68
AMD Radeon
R9 280X
75.44
AMD Radeon
HD 7970
70.13
nVidia GeForce
GTX 670
67.87
nVidia GeForce
GTX 760
62.41
nVidia GeForce
GTX 660 Ti
60.36
AMD Radeon
R9 270X
54.79
nVidia GeForce
GTX 660
52.91
AMD Radeon
R9 270
51.11
nVidia GeForce
GTX 580
51.04
AMD Radeon
HD 7870
50.55
nVidia GeForce
GTX 650 Ti Boost
45.77
AMD Radeon
HD 6970
43.20
AMD Radeon
HD 7850
43.13
AMD Radeon
HD 5870
39.28
AMD Radeon
HD 6950
38.13
nVidia GeForce
GTX 650 Ti
34.89
AMD Radeon
HD 7790
34.65
AMD Radeon
HD 6870
33.69
AMD Radeon
HD 5850
32.42
More is better
[pagebreak]
Crysis 3
High Preset, 1920x1080, 8xMSAA, Very High
Average FPS
nVidia GeForce
GTX 780 Ti
33.8
nVidia GeForce
GTX TITAN
31.8
nVidia GeForce
GTX 780
30.2
AMD Radeon R9 290X
27.3
AMD Radeon
HD 6990
26.8
nVidia GeForce
GTX 770
25.8
nVidia GeForce
GTX 680
24.4
nVidia GeForce
GTX 670
22.2
nVidia GeForce
GTX 760
20.4
AMD Radeon
HD 7970 GHz Edition
19.8
AMD Radeon
R9 280X
19.4
nVidia GeForce
GTX 660 Ti
18.8
AMD Radeon
HD 7970
18.4
nVidia GeForce
GTX 580
17.0
nVidia GeForce
GTX 660
16.8
nVidia GeForce
GTX 650 Ti Boost
15.0
AMD Radeon
R9 270X
15.0
AMD Radeon
HD 6970
14.6
AMD Radeon
HD 7870
14.2
AMD Radeon
R9 270
14.0
AMD Radeon
HD 6950
12.2
AMD Radeon
HD 7850
11.8
nVidia GeForce
GTX 650 Ti
10.2
AMD Radeon
HD 6870
8.4
AMD Radeon
HD 7790
8.0
AMD Radeon
HD 5870
8.0
AMD Radeon
HD 5850
7.6
More is better
[pagebreak]
Call of Duty Black Ops 2
High Preset, 1920x1080, 8xMSAA, High
Average FPS
AMD Radeon R9 290X
146.0
nVidia GeForce
GTX 780 Ti
137.2
nVidia GeForce
GTX TITAN
130.2
AMD Radeon
HD 6990
127.0
nVidia GeForce
GTX 780
121.0
nVidia GeForce
GTX 770
109.0
nVidia GeForce
GTX 680
105.4
AMD Radeon
HD 7970 GHz Edition
103.6
AMD Radeon
R9 280X
102.8
nVidia GeForce
GTX 670
95.8
AMD Radeon
HD 7970
93.2
nVidia GeForce
GTX 760
86.0
AMD Radeon
R9 270X
84.4
nVidia GeForce
GTX 580
81.8
nVidia GeForce
GTX 660 Ti
81.4
AMD Radeon
HD 7870
79.2
AMD Radeon
R9 270
79.0
nVidia GeForce
GTX 660
72.0
AMD Radeon
HD 7850
69.0
AMD Radeon
HD 6970
68.6
AMD Radeon
HD 5870
64.6
AMD Radeon
HD 6950
62.4
nVidia GeForce
GTX 650 Ti Boost
62.4
AMD Radeon
HD 6870
58.4
AMD Radeon
HD 5850
54.4
nVidia GeForce
GTX 650 Ti
48.2
AMD Radeon
HD 7790
46.4
More is better
[pagebreak]
DIRT Showdown - Benchmark
High Preset, 1920x1080, 8xMSAA, Ultra
Average FPS
AMD Radeon R9 290X
107.93
nVidia GeForce
GTX 780 Ti
98.04
nVidia GeForce
GTX TITAN
87.97
nVidia GeForce
GTX 780
82.36
AMD Radeon
HD 6990
80.30
AMD Radeon
HD 7970 GHz Edition
79.22
AMD Radeon
R9 280X
76.46
AMD Radeon
HD 7970
71.63
nVidia GeForce
GTX 770
68.79
nVidia GeForce
GTX 680
67.04
AMD Radeon
R9 270X
64.63
AMD Radeon
R9 270
62.99
AMD Radeon
HD 7870
62.53
nVidia GeForce
GTX 670
58.98
nVidia GeForce
GTX 660 Ti
54.27
nVidia GeForce
GTX 760
52.48
AMD Radeon
HD 7850
50.61
nVidia GeForce
GTX 580
48.92
nVidia GeForce
GTX 660
45.35
AMD Radeon
HD 6970
44.19
AMD Radeon
HD 7790
43.28
AMD Radeon
HD 6950
38.94
nVidia GeForce
GTX 650 Ti Boost
38.02
AMD Radeon
HD 5870
36.48
nVidia GeForce
GTX 650 Ti
30.35
AMD Radeon
HD 6870
30.05
AMD Radeon
HD 5850
29.13
More is better
[pagebreak]
Far Cry 3
High Preset, 1920x1080, 8xMSAA, Ultra
Average FPS
AMD Radeon R9 290X
53.3
nVidia GeForce
GTX 780 Ti
53.2
nVidia GeForce
GTX TITAN
50.2
nVidia GeForce
GTX 780
47.2
AMD Radeon
HD 6990
39.8
nVidia GeForce
GTX 770
38.2
nVidia GeForce
GTX 680
35.6
nVidia GeForce
GTX 670
32.2
AMD Radeon
HD 7970 GHz Edition
31.0
AMD Radeon
R9 280X
30.0
nVidia GeForce
GTX 760
29.4
AMD Radeon
HD 7970
27.8
nVidia GeForce
GTX 660 Ti
27.0
nVidia GeForce
GTX 580
24.8
nVidia GeForce
GTX 660
24.6
AMD Radeon
R9 270X
23.8
AMD Radeon
HD 7870
22.4
AMD Radeon
R9 270
22.0
nVidia GeForce
GTX 650 Ti Boost
21.2
AMD Radeon
HD 6970
20.6
AMD Radeon
HD 6950
18.0
AMD Radeon
HD 7850
17.8
nVidia GeForce
GTX 650 Ti
15.4
AMD Radeon
HD 5870
15.2
AMD Radeon
HD 6870
13.0
AMD Radeon
HD 5850
13.0
AMD Radeon
HD 7790
10.6
More is better
[pagebreak]
Sleeping Dogs - Benchmark
High Preset, 1920x1080, Extreme, High-Res Textures
Average FPS
AMD Radeon R9 290X
69.9
nVidia GeForce
GTX 780 Ti
69.8
nVidia GeForce
GTX TITAN
62.4
nVidia GeForce
GTX 780
58.7
AMD Radeon
HD 6990
56.6
AMD Radeon
HD 7970 GHz Edition
51.7
nVidia GeForce
GTX 770
51.7
AMD Radeon
R9 280X
50.7
nVidia GeForce
GTX 680
48.7
AMD Radeon
HD 7970
47.0
nVidia GeForce
GTX 670
42.7
nVidia GeForce
GTX 760
38.7
nVidia GeForce
GTX 660 Ti
38.7
AMD Radeon
R9 270X
36.4
nVidia GeForce
GTX 580
35.1
AMD Radeon
R9 270
34.2
AMD Radeon
HD 7870
33.8
nVidia GeForce
GTX 660
32.0
AMD Radeon
HD 6970
30.0
AMD Radeon
HD 7850
27.6
AMD Radeon
HD 5870
27.3
nVidia GeForce
GTX 650 Ti Boost
26.3
AMD Radeon
HD 6950
26.2
AMD Radeon
HD 6870
22.9
AMD Radeon
HD 7790
22.2
AMD Radeon
HD 5850
22.2
nVidia GeForce
GTX 650 Ti
19.9
More is better
[pagebreak]
The Elder Scrolls V: Skyrim
High Preset, 1920x1080, 8xAA, Ultra
Average FPS
nVidia GeForce
GTX 780 Ti
135.0
AMD Radeon R9 290X
133.2
nVidia GeForce
GTX TITAN
127.2
nVidia GeForce
GTX 780
126.2
AMD Radeon
HD 7970 GHz Edition
110.4
AMD Radeon
HD 6990
109.2
nVidia GeForce
GTX 770
109.0
nVidia GeForce
GTX 680
106.4
AMD Radeon
R9 280X
106.0
AMD Radeon
HD 7970
98.6
nVidia GeForce
GTX 670
96.4
AMD Radeon
R9 270X
90.4
nVidia GeForce
GTX 760
87.6
AMD Radeon
HD 7870
85.2
nVidia GeForce
GTX 580
84.8
AMD Radeon
R9 270
82.8
nVidia GeForce
GTX 660 Ti
81.4
nVidia GeForce
GTX 660
73.0
AMD Radeon
HD 7850
71.0
AMD Radeon
HD 6970
64.0
nVidia GeForce
GTX 650 Ti Boost
63.2
AMD Radeon
HD 6950
58.4
AMD Radeon
HD 5870
56.6
AMD Radeon
HD 7790
56.2
AMD Radeon
HD 6870
52.0
AMD Radeon
HD 5850
48.6
nVidia GeForce
GTX 650 Ti
47.2
More is better
[pagebreak]
Metro: Last Light - Benchmark
Very High, 1920x1080, SSAA, DX11
Average FPS
AMD Radeon R9 290X
46.58
nVidia GeForce
GTX 780 Ti
45.19
nVidia GeForce
GTX TITAN
39.94
nVidia GeForce
GTX 780
38.18
AMD Radeon
R9 280X
33.78
AMD Radeon
HD 7970 GHz Edition
33.41
nVidia GeForce
GTX 770
32.53
AMD Radeon
HD 7970
30.98
nVidia GeForce
GTX 680
30.56
AMD Radeon
HD 6990
27.65
nVidia GeForce
GTX 670
27.30
nVidia GeForce
GTX 760
25.09
nVidia GeForce
GTX 660 Ti
23.97
AMD Radeon
R9 270X
23.46
nVidia GeForce
GTX 580
23.25
AMD Radeon
R9 270
21.93
AMD Radeon
HD 7870
21.58
nVidia GeForce
GTX 660
20.84
AMD Radeon
HD 7850
18.09
nVidia GeForce
GTX 650 Ti Boost
17.83
AMD Radeon
HD 6970
17.05
AMD Radeon
HD 6950
15.22
AMD Radeon
HD 7790
14.94
nVidia GeForce
GTX 650 Ti
13.83
AMD Radeon
HD 5870
13.33
AMD Radeon
HD 6870
12.37
AMD Radeon
HD 5850
11.11
More is better
[pagebreak]
Grand Theft Auto V
[pagebreak]
Power Consumption
Power
Consumption Idle* Watts
AMD Radeon
HD 6990 (Ref)
80
nVidia GeForce
GTX 580 (Ref)
69
AMD Radeon
HD 7970 GHz Edition (ASUS Matrix P.)
60
AMD Radeon
HD 6970 (Ref)
57
AMD Radeon
HD 6950 (Ref)
57
AMD Radeon R9 290X
(Ref)
57
AMD Radeon
HD 5850 (Ref)
56
AMD Radeon
HD 6870 (Ref)
54
nVidia GeForce
GTX 780 (ASUS DC2OC)
54
nVidia GeForce
GTX 660 Ti (ASUS DC2T)
54
AMD Radeon
HD 5870 (Ref)
53
AMD Radeon
R9 270 (ASUS DC2OC)
53
nVidia GeForce
GTX 770 (ASUS DC2OC)
53
nVidia GeForce
GTX 670 (ASUS DC2T)
52
nVidia GeForce
GTX 680 (Ref)
51
nVidia GeForce
GTX 660 (ASUS DC2T)
50
nVidia GeForce
GTX 780 Ti (GBT GHz)
48
AMD Radeon
HD 7870 (ASUS DC2T V2)
48
AMD Radeon
R9 280X (ASUS DC2T)
48
AMD Radeon
R9 270X (ASUS DC2T)
48
AMD Radeon
HD 7970 (XFX DD - Ref PCB)
47
nVidia GeForce
GTX TITAN (Ref)
47
nVidia GeForce
GTX 650 Ti (ASUS DC2T)
45
AMD Radeon
HD 7850 (ASUS DC2T)
45
AMD Radeon
HD 7790 (ASUS DC2OC - Ref PCB)
45
nVidia GeForce
GTX 760 (ASUS DC2OC)
45
nVidia GeForce
GTX 650 Ti Boost (Ref)
43
*Entire system
Less is better
Power Consumption
Load
(FurMark)* Watts
AMD Radeon
HD 6990 (Ref)
481
AMD Radeon R9 290X
(Ref)
425
AMD Radeon
HD 7970 GHz Edition (ASUS Matrix P.)
360
nVidia GeForce
GTX 780 Ti (GBT GHz)
333
AMD Radeon
HD 7970 (XFX DD - Ref PCB)
323
AMD Radeon
R9 280X (ASUS DC2T)
320
nVidia GeForce
GTX TITAN (Ref)
306
nVidia GeForce
GTX 780 (ASUS DC2OC)
302
nVidia GeForce
GTX 680 (Ref)
258
nVidia GeForce
GTX 770 (ASUS DC2OC)
257
nVidia GeForce
GTX 580 (Ref)
254
AMD Radeon
HD 6970 (Ref)
244
AMD Radeon
HD 5870 (Ref)
232
nVidia GeForce
GTX 670 (ASUS DC2T)
227
AMD Radeon
R9 270X (ASUS DC2T)
223
AMD Radeon
HD 7870 (ASUS DC2T V2)
220
nVidia GeForce
GTX 760 (ASUS DC2OC)
218
AMD Radeon
HD 6950 (Ref)
208
AMD Radeon
HD 6870 (Ref)
200
AMD Radeon
HD 7850 (ASUS DC2T)
195
AMD Radeon
R9 270 (ASUS DC2OC)
194
AMD Radeon
HD 5850 (Ref)
193
nVidia GeForce
GTX 660 Ti (ASUS DC2T)
178
nVidia GeForce
GTX 660 (ASUS DC2T)
177
nVidia GeForce
GTX 650 Ti Boost (Ref)
169
AMD Radeon
HD 7790 (ASUS DC2OC - Ref PCB)
152
nVidia GeForce
GTX 650 Ti (ASUS DC2T)
151
*Entire system
Less is better
[pagebreak]
Performance/Watt
Graphics Cards
Performance Index
Power
C. (Watts)*
Performance/Watt*10
nVidia GeForce
GTX 660 Ti (ASUS DC2T)
53.55
178
3.01
nVidia GeForce
GTX TITAN (Ref)
85.05
306
2.78
nVidia GeForce
GTX 770 (ASUS DC2OC)
70.92
257
2.76
nVidia GeForce
GTX 670 (ASUS DC2T)
62.00
227
2.73
nVidia GeForce
GTX 780 Ti (GBT GHz)
90.53
333
2.72
nVidia GeForce
GTX 780 (ASUS DC2OC)
81.66
302
2.70
nVidia GeForce
GTX 660 (ASUS DC2T)
47.37
177
2.68
nVidia GeForce
GTX 680 (Ref)
68.36
258
2.65
nVidia GeForce
GTX 760 (ASUS DC2OC)
56.63
218
2.60
AMD Radeon
R9 270 (ASUS DC2OC)
49.98
194
2.58
nVidia GeForce
GTX 650 Ti Boost (Ref)
40.87
169
2.42
AMD Radeon
R9 270X (ASUS DC2T)
53.39
223
2.39
AMD Radeon R9 290X
(Ref)
97.83
425
2.30
AMD Radeon
HD 7870 (ASUS DC2T V2)
50.03
220
2.27
AMD Radeon
HD 7850 (ASUS DC2T)
42.04
195
2.16
AMD Radeon
HD 7790 (ASUS DC2OC - Ref PCB)
32.75
152
2.15
AMD Radeon
R9 280X (ASUS DC2T)
68.40
320
2.14
nVidia GeForce
GTX 650 Ti (ASUS DC2T)
30.8
151
2.04
nVidia GeForce
GTX 580 (Ref)
50.49
254
1.99
AMD Radeon
HD 7970 (XFX DD - Ref PCB)
63.41
323
1.96
AMD Radeon
HD 7970 GHz Edition (ASUS Matrix P.)
69.99
360
1.94
AMD Radeon
HD 6950 (Ref)
36.83
208
1.77
AMD Radeon
HD 6970 (Ref)
41.32
244
1.69
AMD Radeon
HD 6870 (Ref)
31.88
200
1.59
AMD Radeon
HD 5850 (Ref)
30.05
193
1.56
AMD Radeon
HD 5870 (Ref)
35.98
232
1.55
AMD Radeon
HD 6990 (Ref)
73.96
481
1.54
*Entire system
More is better
Less is better
More is better
The "Performance Index" value is calculated as the sum of
all benchmarks results divided by the amount of games (3DMark and Unigine are
not included into the calculation).
Performance/Price
Graphics Cards
Performance Index
Price (�)
Performance/�*10
nVidia GeForce
GTX 650 Ti Boost
40.87
108
3.78
AMD Radeon
HD 7870
50.03
135
3.71
AMD Radeon
R9 270
49.98
147
3.40
AMD Radeon
HD 7850
40.04
119
3.36
AMD Radeon
HD 7790
32.75
98
3.34
nVidia GeForce
GTX 660
47.37
143
3.31
AMD Radeon
R9 270X
53.39
162
3.30
nVidia GeForce
GTX 650 Ti
30.80
100
3.08
nVidia GeForce
GTX 670
62.00
214
2.90
nVidia GeForce
GTX 660 Ti
53.55
190
2.82
AMD Radeon
HD 7970
63.41
220
2.88
nVidia GeForce
GTX 760
56.63
198
2.86
AMD Radeon
R9 280X
68.40
240
2.85
nVidia GeForce
GTX 770
70.92
265
2.68
AMD Radeon
HD 6870
31.88
125
2.55
AMD Radeon
HD 7970 GHz Edition
69.99
275
2.55
nVidia GeForce
GTX 680
68.36
300
2.28
nVidia GeForce
GTX 780
81.66
393
2.08
AMD Radeon
HD 6950
36.83
204
1.81
nVidia GeForce
GTX 780 Ti
90.53
563
1.61
nVidia GeForce
GTX 580
50.49
340
1.49
AMD Radeon
HD 5870
35.98
252
1.43
AMD Radeon R9 290X
97.83
687
1.42
AMD Radeon
HD 6970
41.32
310
1.33
AMD Radeon
HD 5850
30.05
245
1.23
AMD Radeon
HD 6990
73.96
671
1.10
nVidia GeForce
GTX TITAN
85.05
833
1.02
More is better
Less is better
More is better
For
the price we took the lowest price available on geizhals.eu.
 As usual we have used an up to date system with three synthetic benchmarks and ten more or less recent games, benched at 1920x1080 with highest graphics settings. Only reference cards from both nVidia and AMD/ATI will be listed (aka no AIB cards). The idea behind is to show a performance overview of the current gaming graphics cards.
 Article in English
 Artikel in Deutsch
 Article en français
 Articolo in italiano