Gigabyte Radeon R9 270X OC Review
Category : AMD
Published by Christian Ney on 01.11.13
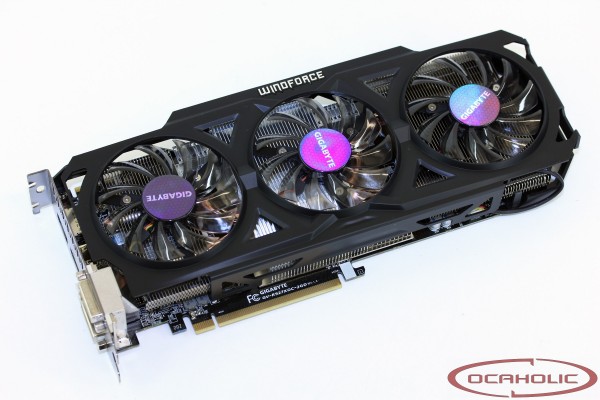
 Today we're having a closer look at Gigabyte Radeon R9 270X OC. This card features a custom PCB as well as a custom cooler. Other than that there is even a factory overclocking. These are three reasons to definitely have a look at this card, and when we tell you that it even comes with an attractive price, then you should definitely give the following pages a shot.
 Article in English Article in English |
 Artikel in Deutsch Artikel in Deutsch |
 Article en français Article en français |
 Articolo in italiano Articolo in italiano |
On the following pages we will show you the strengths and weaknesses of the Gigabyte Radeon R9 270X OC.
Technical Data / Specifications
Gigabyte ships its Radeon R9 270X OC card with the core clocked at 1'100 MHz and the memory at 1'400 MHz (5'600 effective). Compared to the R9 270X reference clocks the Gigabyte OC has a shy factory overclocking with 50 MHz on the core. Unfortunately no factory overclocking was made on the memory.During our testing we didn't see the PowerTune Boost in action with the Gigabyte OC, the card was always running at full speed of 1'100 MHz under load even under Furmark.

| MSI HAWK | ASUS DirectCU II Top |
Gigabyte OC | Radeon R9 270X | |
| Chip | Pitcairn XTL Curacao XT |
Pitcairn XTL Curacao XT |
Pitcairn XTL Curacao XT |
Pitcairn XTL Curacao XT |
| Process | 28 nm | 28 nm | 28 nm | 28 nm |
| Transistors | 2.80 billion | 2.80 billion | 2.80 billion | 2.80 billion |
| GPU clock | 1'150 MHz | 1'120 MHz | 1'100 MHz | 1'050 MHz |
| Memory GDDR5 | 2'048 MB | 2'048 MB | 2'048 MB | 2'048 MB |
| Memory clock | 1'400 (5'600) MHz | 1'400 (5'600) MHz | 1'400 (5'600) MHz | 1'400 (5'600) MHz |
| Memory interface | 256 Bit | 256 Bit | 256 Bit | 256 Bit |
| Memory bandwidth | 179.2 GB/s | 179.2 GB/s | 179.2 GB/s | 179.2 GB/s |
| Shader Cores | 1'280 | 1'280 | 1'280 | 1'280 |
| TMUs | 80 | 80 | 80 | 80 |
| ROPs | 32 | 32 | 32 | 32 |
| TDP | 161 Watt | xxx Watt | xxx Watt | 180 Watt |
| PCB Type | Custom Design | Custom Design | Custom Design | Reference Design |
| Lenght (PCB - Total) | 25.4 - 26.1 cm | 24.3 - 27.3 cm | 23.8 - 28.5 cm | xx.x - xx.x cm |
| Height (PCB - Total) | 12.1 - 13.0 cm | 11.2 - 13.2 cm | 11.0 - 12.0 cm | 11.0 - 11.0 cm |
| Slots | 2 | 2 | 2 | 2 |
| Cooler | Twin Frozr IV Advanced | DirectCU II | WindForce 3X | AMD Reference |
| Launch Price | $XXX | $XXX | $XXX | $199 |
To cool its Radeon R9 270X OC, Gigabyte makes use of their very own WindForce 3X cooler. However it is not the WindForce 3X we are used to see, this one is completely different despite the same name. In this case you get only two eight millimetres copper heatpipes (non nickel plated), there are no six millimetres. The heatpipes are not in direct contact with the core, there is an extra copper plate in-between. Soldered to the heatpipes you find the fin stacks which are being fed with fresh air via three 80mm fans. They are manufactured by Everflow, carry the model number T128010SU and have been inclined in order to blow the air away better at the top of the card. manufactured by Everflow. Overall the cooler is well made and finished, there is only the area around the copper base that didn't get enough attention leading to what we call an industrial look. The copper base has been well lapped but doesn't have a perfect mirror finish. The thermal paste used is of good quality, soft and hasn't been uselessly spread in large quantity all around the chip.
Around the base you find an aluminium part which is used to fix the cooler to the PCB and also to cool all memory chips thanks to thermal pads. The MOSFETs are also actively cooled but with a separate little aluminium heatsink, right below a fan.

|   
|
At closer look at the custom PCB shows that Gigabyte equipped its card with a so called 6+1+1+1 phase power design where the GPU gets six phases and the memory, PLL (VDDCI) and PCIe one.
Checking the voltage regulation chip we find a digital dual output 6+2 phase PWM controller IR3567A from International Rectifier for the GPU and memory voltage regulation. There are also two uP1542S from uPI Semiconductor ont the PCB, the one closer to the end of the card takes care of PLL (VDDCI) while the one close to the PCIe connector takes care of the PCIe.

|   
|
The memory chips used are made by Elpida and carry the model number W2032BBBG-6A-F. They are specified to run at 1'500 MHz (6'000 MHz effective).

Preview


Delivery


The card ships well bolstered in a foam made mold. Bundled with the graphics card there is a software CD, an installation manual, a soft CrossFire bridge and two power adapters (2x Molex to PCIe-6pin).
Test Setup
Hardware
| Mainboard |
|
| CPUs |
|
| Memory |
|
| Graphic Cards (Driver) |
|
| Drivers |
|
| Games and OS |
|
| HDD |
|
| PSU |
|


3DMark - Fire Strike Performance

| Graphics Cards | Score | Graphics Score |
| nVidia GeForce GTX TITAN | 8'396 | 9'420 |
| nVidia GeForce GTX 780 | 7'877 | 8'734 |
| AMD Radeon HD 7970 GHz Edition | 7'091 | 7'922 |
| AMD Radeon R9 280X | 7'093 | 7'837 |
| nVidia GeForce GTX 770 | 6'679 | 7'408 |
| AMD Radeon HD 7970 | 6'578 | 7'215 |
| AMD Radeon HD 6990 | 6'350 | 7'207 |
| nVidia GeForce GTX 680 | 6'402 | 7'102 |
| MSI Radeon R9 270X HAWK | 5'674 | 6'224 |
| nVidia GeForce GTX 670 | 5'624 | 6'099 |
| Gigabyte Radeon R9 270X OC | 5'524 | 6'037 |
| ASUS Radeon R9 270X DirectCU II Top | 5'521 | 6'039 |
| AMD Radeon R9 270X | 5'318 | 5'784 |
| nVidia GeForce GTX 760 | 5'243 | 5'645 |
| AMD Radeon HD 7870 | 5'009 | 5'436 |
| nVidia GeForce GTX 660 Ti | 4'885 | 5'270 |
| nVidia GeForce GTX 580 | 4'545 | 4'975 |
| nVidia GeForce GTX 660 | 4'415 | 4'707 |
| AMD Radeon HD 7850 | 4'176 | 4'460 |
| nVidia GeForce GTX 650 Ti Boost | 3'762 | 3'962 |
| AMD Radeon HD 6970 | 3'742 | 3'880 |
| AMD Radeon HD 7790 | 3'546 | 3'823 |
| AMD Radeon HD 6950 | 3'338 | 3'446 |
| AMD Radeon HD 5870 | 3'232 | 3'299 |
| nVidia GeForce GTX 650 Ti | 3'031 | 3'182 |
| AMD Radeon HD 6870 | 2'991 | 3'096 |
| AMD Radeon HD 5850 | 2'710 | 2'751 |
| More is better | ||

3DMark - Fire Strike Extreme

| Graphics Cards | Score | Graphics Score |
| nVidia GeForce GTX TITAN | 4'271 | 4'420 |
| nVidia GeForce GTX 780 | 4'007 | 4'121 |
| AMD Radeon HD 7970 GHz Edition | 3'568 | 3'720 |
| AMD Radeon R9 280X | 3'564 | 3'668 |
| nVidia GeForce GTX 770 | 3'319 | 3'448 |
| AMD Radeon HD 6990 | 3'185 | 3'274 |
| AMD Radeon HD 7970 | 3'291 | 3'383 |
| nVidia GeForce GTX 680 | 3'176 | 3'286 |
| MSI Radeon R9 270X HAWK | 2'837 | 2'933 |
| nVidia GeForce GTX 670 | 2'805 | 2'872 |
| ASUS Radeon R9 270X DirectCU II Top | 2'760 | 2'855 |
| Gigabyte Radeon R9 270X OC | 2'760 | 2'846 |
| AMD Radeon R9 270X | 2'657 | 2'739 |
| nVidia GeForce GTX 760 | 2'610 | 2'655 |
| AMD Radeon HD 7870 | 2'484 | 2'560 |
| nVidia GeForce GTX 660 Ti | 2'378 | 2'440 |
| nVidia GeForce GTX 580 | 2'213 | 2'350 |
| nVidia GeForce GTX 660 | 2'178 | 2'202 |
| AMD Radeon HD 7850 | 2'044 | 2'073 |
| nVidia GeForce GTX 650 Ti Boost | 1'842 | 1'848 |
| AMD Radeon HD 6970 | 1'784 | 1'760 |
| AMD Radeon HD 6950 | 1'585 | 1'555 |
| AMD Radeon HD 7790 | 1'456 | 1'437 |
| AMD Radeon HD 6870 | 1'101 | 1'025 |
| AMD Radeon HD 5870 | 1'005 | 1'005 |
| nVidia GeForce GTX 650 Ti | 942 | 983 |
| AMD Radeon HD 5850 | 959 | 878 |
| More is better | ||

Unigine Heaven 4.0 Extreme Preset

| Graphics Cards | Score | fps |
| nVidia GeForce GTX TITAN | 1'594 | 63.3 |
| nVidia GeForce GTX 780 | 1'537 | 61.0 |
| nVidia GeForce GTX 680 | 1'261 | 50.0 |
| nVidia GeForce GTX 770 | 1'204 | 47.8 |
| AMD Radeon HD 6990 | 1'156 | 45.9 |
| AMD Radeon HD 7970 GHz Edition | 1'137 | 45.1 |
| AMD Radeon R9 280X | 1'113 | 44.2 |
| AMD Radeon HD 7970 | 1'034 | 41.1 |
| nVidia GeForce GTX 670 | 1'028 | 40.8 |
| nVidia GeForce GTX 760 | 951 | 37.8 |
| MSI Radeon R9 270X HAWK | 944 | 37.5 |
| ASUS Radeon R9 270X DirectCU II Top | 921 | 36.5 |
| Gigabyte Radeon R9 270X OC | 918 | 36.4 |
| nVidia GeForce GTX 580 | 915 | 36.3 |
| AMD Radeon R9 270X | 886 | 35.2 |
| nVidia GeForce GTX 660 Ti | 866 | 34.4 |
| AMD Radeon HD 7870 | 826 | 32.8 |
| nVidia GeForce GTX 660 | 801 | 31.8 |
| nVidia GeForce GTX 650 Ti Boost | 705 | 28.0 |
| AMD Radeon HD 7850 | 684 | 27.2 |
| AMD Radeon HD 6970 | 620 | 24.6 |
| AMD Radeon HD 7790 | 568 | 22.5 |
| AMD Radeon HD 6950 | 556 | 22.1 |
| AMD Radeon HD 6870 | 510 | 20.3 |
| nVidia GeForce GTX 650 Ti | 498 | 19.8 |
| AMD Radeon HD 5870 | 478 | 19.0 |
| AMD Radeon HD 5850 | 403 | 16.0 |
| More is better | ||
BattleField 3

| High Preset, 1920x1080, 4xMSAA, Ultra, SSAO | Average FPS |
| nVidia GeForce GTX TITAN | 96.4 |
| nVidia GeForce GTX 780 | 90.4 |
| AMD Radeon HD 7970 GHz Edition | 78.4 |
| AMD Radeon R9 280X | 76.6 |
| nVidia GeForce GTX 770 | 76.6 |
| nVidia GeForce GTX 680 | 72.8 |
| AMD Radeon HD 7970 | 71.2 |
| nVidia GeForce GTX 670 | 66.0 |
| AMD Radeon HD 6990 | 65.6 |
| MSI Radeon R9 270X HAWK | 62.2 |
| nVidia GeForce GTX 760 | 62.0 |
| ASUS Radeon R9 270X DirectCU II Top | 61.0 |
| Gigabyte Radeon R9 270X OC | 59.8 |
| AMD Radeon R9 270X | 58.2 |
| nVidia GeForce GTX 660 Ti | 55.8 |
| AMD Radeon HD 7870 | 54.2 |
| nVidia GeForce GTX 660 | 50.6 |
| nVidia GeForce GTX 580 | 48.6 |
| AMD Radeon HD 7850 | 44.6 |
| nVidia GeForce GTX 650 Ti Boost | 44.2 |
| AMD Radeon HD 7790 | 36.6 |
| AMD Radeon HD 6970 | 35.8 |
| nVidia GeForce GTX 650 Ti | 33.2 |
| AMD Radeon HD 5870 | 32.6 |
| AMD Radeon HD 6950 | 32.0 |
| AMD Radeon HD 6870 | 29.8 |
| AMD Radeon HD 5850 | 26.6 |
| More is better |

Borderlands 2

| High Preset, 1920x1080, FXAA, no PhsyX, High | Average FPS |
| nVidia GeForce GTX 780 | 131.6 |
| nVidia GeForce GTX TITAN | 128.8 |
| AMD Radeon HD 6990 | 128.6 |
| nVidia GeForce GTX 770 | 118.6 |
| nVidia GeForce GTX 680 | 117.0 |
| AMD Radeon HD 7970 GHz Edition | 115.6 |
| AMD Radeon R9 280X | 112.8 |
| nVidia GeForce GTX 670 | 110.5 |
| AMD Radeon HD 7970 | 105.2 |
| nVidia GeForce GTX 760 | 102.2 |
| nVidia GeForce GTX 660 Ti | 93.8 |
| nVidia GeForce GTX 580 | 89.6 |
| MSI Radeon R9 270X HAWK | 87.2 |
| ASUS Radeon R9 270X DirectCU II Top | 85.8 |
| nVidia GeForce GTX 660 | 85.6 |
| Gigabyte Radeon R9 270X OC | 84.8 |
| AMD Radeon R9 270X | 82.8 |
| AMD Radeon HD 7870 | 76.6 |
| AMD Radeon HD 6970 | 75.2 |
| nVidia GeForce GTX 650 Ti Boost | 74.8 |
| AMD Radeon HD 6950 | 66.8 |
| AMD Radeon HD 7850 | 66.8 |
| AMD Radeon HD 5870 | 66.4 |
| AMD Radeon HD 6870 | 58.2 |
| AMD Radeon HD 5850 | 55.4 |
| nVidia GeForce GTX 650 Ti | 54.8 |
| AMD Radeon HD 7790 | 54.6 |
| More is better |


Bioshock Infinite - Benchmark

| Ultra Preset, 1920x1080, AA, no DDOF | Average FPS |
| nVidia GeForce GTX TITAN | 95.55 |
| nVidia GeForce GTX 780 | 90.78 |
| nVidia GeForce GTX 770 | 78.98 |
| AMD Radeon HD 6990 | 78.01 |
| AMD Radeon HD 7970 GHz Edition | 76.80 |
| nVidia GeForce GTX 680 | 75.68 |
| AMD Radeon R9 280X | 75.44 |
| AMD Radeon HD 7970 | 70.13 |
| nVidia GeForce GTX 670 | 67.87 |
| nVidia GeForce GTX 760 | 62.41 |
| nVidia GeForce GTX 660 Ti | 60.36 |
| MSI Radeon R9 270X HAWK | 57.47 |
| ASUS Radeon R9 270X DirectCU II Top | 56.53 |
| Gigabyte Radeon R9 270X OC | 56.07 |
| AMD Radeon R9 270X | 54.79 |
| nVidia GeForce GTX 660 | 52.91 |
| nVidia GeForce GTX 580 | 51.04 |
| AMD Radeon HD 7870 | 50.55 |
| nVidia GeForce GTX 650 Ti Boost | 45.77 |
| AMD Radeon HD 6970 | 43.20 |
| AMD Radeon HD 7850 | 43.13 |
| AMD Radeon HD 5870 | 39.28 |
| AMD Radeon HD 6950 | 38.13 |
| nVidia GeForce GTX 650 Ti | 34.89 |
| AMD Radeon HD 7790 | 34.65 |
| AMD Radeon HD 6870 | 33.69 |
| AMD Radeon HD 5850 | 32.42 |
| More is better |

Crysis 3

| High Preset, 1920x1080, 8xMSAA, Very High | Average FPS |
| nVidia GeForce GTX TITAN | 31.8 |
| nVidia GeForce GTX 780 | 30.2 |
| AMD Radeon HD 6990 | 26.8 |
| nVidia GeForce GTX 770 | 25.8 |
| nVidia GeForce GTX 680 | 24.4 |
| nVidia GeForce GTX 670 | 22.2 |
| nVidia GeForce GTX 760 | 20.4 |
| AMD Radeon HD 7970 GHz Edition | 19.8 |
| AMD Radeon R9 280X | 19.4 |
| nVidia GeForce GTX 660 Ti | 18.8 |
| AMD Radeon HD 7970 | 18.4 |
| nVidia GeForce GTX 580 | 17.0 |
| nVidia GeForce GTX 660 | 16.8 |
| MSI Radeon R9 270X HAWK | 16.0 |
| Gigabyte Radeon R9 270X OC | 15.6 |
| ASUS Radeon R9 270X DirectCU II Top | 15.4 |
| nVidia GeForce GTX 650 Ti Boost | 15.0 |
| AMD Radeon R9 270X | 15.0 |
| AMD Radeon HD 6970 | 14.6 |
| AMD Radeon HD 7870 | 14.2 |
| AMD Radeon HD 6950 | 12.2 |
| AMD Radeon HD 7850 | 11.8 |
| nVidia GeForce GTX 650 Ti | 10.2 |
| AMD Radeon HD 6870 | 8.4 |
| AMD Radeon HD 7790 | 8.0 |
| AMD Radeon HD 5870 | 8.0 |
| AMD Radeon HD 5850 | 7.6 |
| More is better |


Call of Duty Black Ops 2

| High Preset, 1920x1080, 8xMSAA, High | Average FPS |
| nVidia GeForce GTX TITAN | 130.2 |
| AMD Radeon HD 6990 | 127.0 |
| nVidia GeForce GTX 780 | 121.0 |
| nVidia GeForce GTX 770 | 109.0 |
| nVidia GeForce GTX 680 | 105.4 |
| AMD Radeon HD 7970 GHz Edition | 103.6 |
| AMD Radeon R9 280X | 102.8 |
| nVidia GeForce GTX 670 | 95.8 |
| AMD Radeon HD 7970 | 93.2 |
| MSI Radeon R9 270X HAWK | 89.2 |
| ASUS Radeon R9 270X DirectCU II Top | 88.2 |
| Gigabyte Radeon R9 270X OC | 86.4 |
| nVidia GeForce GTX 760 | 86.0 |
| AMD Radeon R9 270X | 84.4 |
| nVidia GeForce GTX 580 | 81.8 |
| nVidia GeForce GTX 660 Ti | 81.4 |
| AMD Radeon HD 7870 | 79.2 |
| nVidia GeForce GTX 660 | 72.0 |
| AMD Radeon HD 7850 | 69.0 |
| AMD Radeon HD 6970 | 68.6 |
| AMD Radeon HD 5870 | 64.6 |
| AMD Radeon HD 6950 | 62.4 |
| nVidia GeForce GTX 650 Ti Boost | 62.4 |
| AMD Radeon HD 6870 | 58.4 |
| AMD Radeon HD 5850 | 54.4 |
| nVidia GeForce GTX 650 Ti | 48.2 |
| AMD Radeon HD 7790 | 46.4 |
| More is better |

DIRT Showdown - Benchmark

| High Preset, 1920x1080, 8xMSAA, Ultra | Average FPS |
| nVidia GeForce GTX TITAN | 87.97 |
| nVidia GeForce GTX 780 | 82.36 |
| AMD Radeon HD 6990 | 80.30 |
| AMD Radeon HD 7970 GHz Edition | 79.22 |
| AMD Radeon R9 280X | 76.46 |
| MSI Radeon R9 270X HAWK | 71.73 |
| AMD Radeon HD 7970 | 71.63 |
| ASUS Radeon R9 270X DirectCU II Top | 69.91 |
| nVidia GeForce GTX 770 | 68.79 |
| Gigabyte Radeon R9 270X OC | 67.73 |
| nVidia GeForce GTX 680 | 67.04 |
| AMD Radeon R9 270X | 64.63 |
| AMD Radeon HD 7870 | 62.53 |
| nVidia GeForce GTX 670 | 58.98 |
| nVidia GeForce GTX 660 Ti | 54.27 |
| nVidia GeForce GTX 760 | 52.48 |
| AMD Radeon HD 7850 | 50.61 |
| nVidia GeForce GTX 580 | 48.92 |
| nVidia GeForce GTX 660 | 45.35 |
| AMD Radeon HD 6970 | 44.19 |
| AMD Radeon HD 7790 | 43.28 |
| AMD Radeon HD 6950 | 38.94 |
| nVidia GeForce GTX 650 Ti Boost | 38.02 |
| AMD Radeon HD 5870 | 36.48 |
| nVidia GeForce GTX 650 Ti | 30.35 |
| AMD Radeon HD 6870 | 30.05 |
| AMD Radeon HD 5850 | 29.13 |
| More is better |


Far Cry 3
| High Preset, 1920x1080, 8xMSAA, Ultra | Average FPS |
| nVidia GeForce GTX TITAN | 50.2 |
| nVidia GeForce GTX 780 | 47.2 |
| AMD Radeon HD 6990 | 39.8 |
| nVidia GeForce GTX 770 | 38.2 |
| nVidia GeForce GTX 680 | 35.6 |
| nVidia GeForce GTX 670 | 32.2 |
| AMD Radeon HD 7970 GHz Edition | 31.0 |
| AMD Radeon R9 280X | 30.0 |
| nVidia GeForce GTX 760 | 29.4 |
| AMD Radeon HD 7970 | 27.8 |
| nVidia GeForce GTX 660 Ti | 27.0 |
| MSI Radeon R9 270X HAWK | 25.4 |
| nVidia GeForce GTX 580 | 24.8 |
| ASUS Radeon R9 270X DirectCU II Top | 24.8 |
| Gigabyte Radeon R9 270X OC | 24.6 |
| nVidia GeForce GTX 660 | 24.6 |
| AMD Radeon R9 270X | 23.8 |
| AMD Radeon HD 7870 | 22.4 |
| nVidia GeForce GTX 650 Ti Boost | 21.2 |
| AMD Radeon HD 6970 | 20.6 |
| AMD Radeon HD 6950 | 18.0 |
| AMD Radeon HD 7850 | 17.8 |
| nVidia GeForce GTX 650 Ti | 15.4 |
| AMD Radeon HD 5870 | 15.2 |
| AMD Radeon HD 6870 | 13.0 |
| AMD Radeon HD 5850 | 13.0 |
| AMD Radeon HD 7790 | 10.6 |
| More is better |

Sleeping Dogs - Benchmark

| High Preset, 1920x1080, Extreme, High-Res Textures | Average FPS |
| nVidia GeForce GTX TITAN | 62.4 |
| nVidia GeForce GTX 780 | 58.7 |
| AMD Radeon HD 6990 | 56.6 |
| AMD Radeon HD 7970 GHz Edition | 51.7 |
| nVidia GeForce GTX 770 | 51.7 |
| AMD Radeon R9 280X | 50.7 |
| nVidia GeForce GTX 680 | 48.7 |
| AMD Radeon HD 7970 | 47.0 |
| nVidia GeForce GTX 670 | 42.7 |
| nVidia GeForce GTX 760 | 38.7 |
| nVidia GeForce GTX 660 Ti | 38.7 |
| MSI Radeon R9 270X HAWK | 38.5 |
| ASUS Radeon R9 270X DirectCU II Top | 37.7 |
| Gigabyte Radeon R9 270X OC | 37.5 |
| AMD Radeon R9 270X | 36.4 |
| nVidia GeForce GTX 580 | 35.1 |
| AMD Radeon HD 7870 | 33.8 |
| nVidia GeForce GTX 660 | 32.0 |
| AMD Radeon HD 6970 | 30.0 |
| AMD Radeon HD 7850 | 27.6 |
| AMD Radeon HD 5870 | 27.3 |
| nVidia GeForce GTX 650 Ti Boost | 26.3 |
| AMD Radeon HD 6950 | 26.2 |
| AMD Radeon HD 6870 | 22.9 |
| AMD Radeon HD 7790 | 22.2 |
| AMD Radeon HD 5850 | 22.2 |
| nVidia GeForce GTX 650 Ti | 19.9 |
| More is better |

The Elder Scrolls V: Skyrim

| High Preset, 1920x1080, 8xAA, Ultra | Average FPS |
| nVidia GeForce GTX TITAN | 127.2 |
| nVidia GeForce GTX 780 | 126.2 |
| AMD Radeon HD 7970 GHz Edition | 110.4 |
| AMD Radeon HD 6990 | 109.2 |
| nVidia GeForce GTX 770 | 109.0 |
| nVidia GeForce GTX 680 | 106.4 |
| AMD Radeon R9 280X | 106.0 |
| AMD Radeon HD 7970 | 98.6 |
| MSI Radeon R9 270X HAWK | 96.8 |
| nVidia GeForce GTX 670 | 96.4 |
| ASUS Radeon R9 270X DirectCU II Top | 94.6 |
| Gigabyte Radeon R9 270X OC | 93.6 |
| AMD Radeon R9 270X | 90.4 |
| nVidia GeForce GTX 760 | 87.6 |
| AMD Radeon HD 7870 | 85.2 |
| nVidia GeForce GTX 580 | 84.8 |
| nVidia GeForce GTX 660 Ti | 81.4 |
| nVidia GeForce GTX 660 | 73.0 |
| AMD Radeon HD 7850 | 71.0 |
| AMD Radeon HD 6970 | 64.0 |
| nVidia GeForce GTX 650 Ti Boost | 63.2 |
| AMD Radeon HD 6950 | 58.4 |
| AMD Radeon HD 5870 | 56.6 |
| AMD Radeon HD 7790 | 56.2 |
| AMD Radeon HD 6870 | 52.0 |
| AMD Radeon HD 5850 | 48.6 |
| nVidia GeForce GTX 650 Ti | 47.2 |
| More is better |

Metro: Last Light - Benchmark

| Very High, 1920x1080, SSAA, DX11 | Average FPS |
| nVidia GeForce GTX TITAN | 39.94 |
| nVidia GeForce GTX 780 | 38.18 |
| AMD Radeon R9 280X | 33.78 |
| AMD Radeon HD 7970 GHz Edition | 33.41 |
| nVidia GeForce GTX 770 | 32.53 |
| AMD Radeon HD 7970 | 30.98 |
| nVidia GeForce GTX 680 | 30.56 |
| AMD Radeon HD 6990 | 27.65 |
| nVidia GeForce GTX 670 | 27.30 |
| nVidia GeForce GTX 760 | 25.09 |
| MSI Radeon R9 270X HAWK | 24.96 |
| ASUS Radeon R9 270X DirectCU II Top | 24.18 |
| Gigabyte Radeon R9 270X OC | 24.14 |
| nVidia GeForce GTX 660 Ti | 23.97 |
| AMD Radeon R9 270X | 23.46 |
| nVidia GeForce GTX 580 | 23.25 |
| AMD Radeon HD 7870 | 21.58 |
| nVidia GeForce GTX 660 | 20.84 |
| AMD Radeon HD 7850 | 18.09 |
| nVidia GeForce GTX 650 Ti Boost | 17.83 |
| AMD Radeon HD 6970 | 17.05 |
| AMD Radeon HD 6950 | 15.22 |
| AMD Radeon HD 7790 | 14.94 |
| nVidia GeForce GTX 650 Ti | 13.83 |
| AMD Radeon HD 5870 | 13.33 |
| AMD Radeon HD 6870 | 12.37 |
| AMD Radeon HD 5850 | 11.11 |
| More is better |

Grand Theft Auto V

Power Consumption

| Power Consumption Idle* | Watts |
| AMD Radeon HD 6990 (Ref) | 80 |
| nVidia GeForce GTX 580 (Ref) | 69 |
| AMD Radeon HD 7970 GHz Edition (ASUS Matrix P.) | 60 |
| AMD Radeon HD 6970 (Ref) | 57 |
| AMD Radeon HD 6950 (Ref) | 57 |
| AMD Radeon HD 5850 (Ref) | 56 |
| AMD Radeon HD 6870 (Ref) | 54 |
| nVidia GeForce GTX 780 (ASUS DC2OC) | 54 |
| nVidia GeForce GTX 660 Ti (ASUS DC2T) | 54 |
| AMD Radeon HD 5870 (Ref) | 53 |
| nVidia GeForce GTX 770 (ASUS DC2OC) | 53 |
| nVidia GeForce GTX 670 (ASUS DC2T) | 52 |
| nVidia GeForce GTX 680 (Ref) | 51 |
| nVidia GeForce GTX 660 (ASUS DC2T) | 50 |
| Gigabyte Radeon R9 270X OC | 49 |
| AMD Radeon HD 7870 (ASUS DC2T V2) | 48 |
| AMD Radeon R9 280X (ASUS DC2T) | 48 |
| AMD Radeon R9 270X (ASUS DC2T) | 48 |
| ASUS Radeon R9 270X DirectCU II Top | 48 |
| AMD Radeon HD 7970 (XFX DD - Ref PCB) | 47 |
| nVidia GeForce GTX TITAN (Ref) | 47 |
| MSI Radeon R9 270X HAWK | 45 |
| nVidia GeForce GTX 650 Ti (ASUS DC2T) | 45 |
| AMD Radeon HD 7850 (ASUS DC2T) | 45 |
| AMD Radeon HD 7790 (ASUS DC2OC - Ref PCB) | 45 |
| nVidia GeForce GTX 760 (ASUS DC2OC) | 45 |
| nVidia GeForce GTX 650 Ti Boost (Ref) | 43 |
| *Entire system | Less is better |
| Power Consumption Load (FurMark)* | Watts |
| AMD Radeon HD 6990 (Ref) | 481 |
| AMD Radeon HD 7970 GHz Edition (ASUS Matrix P.) | 360 |
| AMD Radeon HD 7970 (XFX DD - Ref PCB) | 323 |
| AMD Radeon R9 280X (ASUS DC2T) | 320 |
| nVidia GeForce GTX TITAN (Ref) | 306 |
| nVidia GeForce GTX 780 (ASUS DC2OC) | 302 |
| nVidia GeForce GTX 680 (Ref) | 258 |
| nVidia GeForce GTX 770 (ASUS DC2OC) | 257 |
| MSI Radeon R9 270X HAWK | 257 |
| ASUS Radeon R9 270X DirectCU II Top | 247 |
| nVidia GeForce GTX 580 (Ref) | 254 |
| AMD Radeon HD 6970 (Ref) | 244 |
| Gigabyte Radeon R9 270X OC | 232 |
| AMD Radeon HD 5870 (Ref) | 232 |
| nVidia GeForce GTX 670 (ASUS DC2T) | 227 |
| AMD Radeon R9 270X (ASUS DC2T) | 223 |
| AMD Radeon HD 7870 (ASUS DC2T V2) | 220 |
| nVidia GeForce GTX 760 (ASUS DC2OC) | 218 |
| AMD Radeon HD 6950 (Ref) | 208 |
| AMD Radeon HD 6870 (Ref) | 200 |
| AMD Radeon HD 7850 (ASUS DC2T) | 195 |
| AMD Radeon HD 5850 (Ref) | 193 |
| nVidia GeForce GTX 660 Ti (ASUS DC2T) | 178 |
| nVidia GeForce GTX 660 (ASUS DC2T) | 177 |
| nVidia GeForce GTX 650 Ti Boost (Ref) | 169 |
| AMD Radeon HD 7790 (ASUS DC2OC - Ref PCB) | 152 |
| nVidia GeForce GTX 650 Ti (ASUS DC2T) | 151 |
| *Entire system | Less is better |
| Difference Idle/LoadDifférence Idle/Charge | Watts |
| AMD Radeon HD 6990 (Ref) | 401 |
| AMD Radeon HD 7970 GHz Edition (ASUS Matrix P.) | 300 |
| AMD Radeon HD 7970 (XFX DD - Ref PCB) | 276 |
| AMD Radeon R9 280X (ASUS DC2T) | 272 |
| nVidia GeForce GTX TITAN (Ref) | 259 |
| nVidia GeForce GTX 780 (ASUS DC2OC) | 248 |
| MSI Radeon R9 270X HAWK | 212 |
| nVidia GeForce GTX 680 (Ref) | 207 |
| nVidia GeForce GTX 770 (ASUS DC2OC) | 204 |
| ASUS Radeon R9 270X DirectCU II Top | 199 |
| AMD Radeon HD 6970 (Ref) | 187 |
| nVidia GeForce GTX 580 (Ref) | 185 |
| Gigabyte Radeon R9 270X OC | 183 |
| AMD Radeon HD 5870 (Ref) | 179 |
| AMD Radeon R9 270X (ASUS DC2T) | 175 |
| nVidia GeForce GTX 670 (ASUS DC2T) | 175 |
| nVidia GeForce GTX 760 (ASUS DC2OC) | 173 |
| AMD Radeon HD 7870 (ASUS DC2T V2) | 172 |
| AMD Radeon HD 6950 (Ref) | 151 |
| AMD Radeon HD 7850 (ASUS DC2T) | 150 |
| AMD Radeon HD 6870 (Ref) | 146 |
| AMD Radeon HD 5850 (Ref) | 137 |
| nVidia GeForce GTX 660 (ASUS DC2T) | 127 |
| nVidia GeForce GTX 650 Ti Boost (Ref) | 126 |
| nVidia GeForce GTX 660 Ti (ASUS DC2T) | 124 |
| AMD Radeon HD 7790 (ASUS DC2OC - Ref PCB) | 107 |
| nVidia GeForce GTX 650 Ti (ASUS DC2T) | 106 |
| *Entire system | More is better |

Fan Speed / Noise Level
Fan Speed

Noise Level

For the noise level results, we measured the noise level using a decibel meter (Voltcraft SL-200) located at 1 meter away from the graphics card.
Idle / FurMark / BF3
Idle Temperature

Idle, temperature is taken after 15 minutes @ lowest, 40 %, 50 %, 70 % and 100 % fan speed.
Room Temperature: 25°C
Temperature under Furmark

For FurMark, temperature is taken after 15 minutes of GPU Burn test at lowest, 40 %, 50 %, 70 % and 100 % fan speed.
We stopped the test when the GPU temperature hit 90°C.
Room Temperature: 25°C
Temperature and fan speed under BattleField 3

For BattleField 3, temperature and fan speed values taken, are the highest achieved after 1 hour gaming @ auto fan speed.
Performance/Watt
| Graphics Cards | Performance Index | Power C. (Watts)* | Performance/Watt*10 |
| nVidia GeForce GTX 660 Ti (ASUS DC2T) | 53.55 | 178 | 3.01 |
| nVidia GeForce GTX TITAN (Ref) | 85.05 | 306 | 2.78 |
| nVidia GeForce GTX 770 (ASUS DC2OC) | 70.92 | 257 | 2.76 |
| nVidia GeForce GTX 670 (ASUS DC2T) | 62.00 | 227 | 2.73 |
| nVidia GeForce GTX 780 (ASUS DC2OC) | 81.66 | 302 | 2.70 |
| nVidia GeForce GTX 660 (ASUS DC2T) | 47.37 | 177 | 2.68 |
| nVidia GeForce GTX 680 (Ref) | 68.36 | 258 | 2.65 |
| nVidia GeForce GTX 760 (ASUS DC2OC) | 56.63 | 218 | 2.60 |
| nVidia GeForce GTX 650 Ti Boost (Ref) | 40.87 | 169 | 2.42 |
| AMD Radeon R9 270X (ASUS DC2T) | 53.39 | 223 | 2.39 |
| Gigabyte Radeon R9 270X OC | 55.02 | 232 | 2.37 |
| AMD Radeon HD 7870 (ASUS DC2T V2) | 50.03 | 220 | 2.27 |
| ASUS Radeon R9 270X DirectCU II Top | 55.81 | 247 | 2.26 |
| MSI Radeon R9 270X HAWK | 56.95 | 257 | 2.22 |
| AMD Radeon HD 7850 (ASUS DC2T) | 42.04 | 195 | 2.16 |
| AMD Radeon HD 7790 (ASUS DC2OC - Ref PCB) | 32.75 | 152 | 2.15 |
| AMD Radeon R9 280X (ASUS DC2T) | 68.40 | 320 | 2.14 |
| nVidia GeForce GTX 650 Ti (ASUS DC2T) | 30.8 | 151 | 2.04 |
| nVidia GeForce GTX 580 (Ref) | 50.49 | 254 | 1.99 |
| AMD Radeon HD 7970 (XFX DD - Ref PCB) | 63.41 | 323 | 1.96 |
| AMD Radeon HD 7970 GHz Edition (ASUS Matrix P.) | 69.99 | 360 | 1.94 |
| AMD Radeon HD 6950 (Ref) | 36.83 | 208 | 1.77 |
| AMD Radeon HD 6970 (Ref) | 41.32 | 244 | 1.69 |
| AMD Radeon HD 6870 (Ref) | 31.88 | 200 | 1.59 |
| AMD Radeon HD 5850 (Ref) | 30.05 | 193 | 1.56 |
| AMD Radeon HD 5870 (Ref) | 35.98 | 232 | 1.55 |
| AMD Radeon HD 6990 (Ref) | 73.96 | 481 | 1.54 |
| *Entire system | More is better | Less is better | More is better |
The "Performance Index" value is calculated as the sum of all benchmarks results divided by the amount of games (3DMark and Ungine not included into the calculation).
Performance/Price
| Graphics Cards | Performance Index | Price (€)* | Performance/€*10 |
| nVidia GeForce GTX 650 Ti Boost | 40.87 | 106 | 3.86 |
| AMD Radeon HD 7870 | 50.03 | 140 | 3.57 |
| AMD Radeon HD 7790 | 32.75 | 95 | 3.45 |
| nVidia GeForce GTX 660 | 47.37 | 143 | 3.31 |
| AMD Radeon R9 270X | 53.39 | 158 | 3.38 |
| Gigabyte Radeon R9 270X OC | 55.02 | 163 | 3.38 |
| AMD Radeon HD 7850 | 40.04 | 119 | 3.36 |
| nVidia GeForce GTX 770 | 70.92 | 224 | 3.17 |
| nVidia GeForce GTX 650 Ti | 30.80 | 99 | 3.11 |
| MSI Radeon R9 270X HAWK | 56.95 | 183 | 3.11 |
| nVidia GeForce GTX 670 | 62.00 | 204 | 3.04 |
| nVidia GeForce GTX 660 Ti | 53.55 | 176 | 3.04 |
| nVidia GeForce GTX 760 | 56.63 | 191 | 2.96 |
| ASUS Radeon R9 270X DirectCU II Top | 55.81 | 189 | 2.95 |
| AMD Radeon HD 7970 GHz Edition | 69.99 | 240 | 2.92 |
| AMD Radeon R9 280X | 68.40 | 234 | 2.92 |
| AMD Radeon HD 7970 | 63.41 | 233 | 2.72 |
| AMD Radeon HD 6870 | 31.88 | 124 | 2.57 |
| nVidia GeForce GTX 680 | 68.36 | 279 | 2.45 |
| nVidia GeForce GTX 580 | 50.49 | 221 | 2.28 |
| nVidia GeForce GTX 780 | 81.66 | 349 | 2.34 |
| AMD Radeon HD 6950 | 36.83 | 204 | 1.81 |
| AMD Radeon HD 5870 | 35.98 | 244 | 1.47 |
| AMD Radeon HD 5850 | 30.05 | 221 | 1.36 |
| AMD Radeon HD 6970 | 41.32 | 308 | 1.34 |
| AMD Radeon HD 6990 | 73.96 | 648 | 1.14 |
| nVidia GeForce GTX TITAN | 85.05 | 795 | 1.07 |
| * 31/10/2013 | More is better | Less is better | More is better |
For the price we took the lowest price available on geizhals.eu.
Conclusion
| General | + | - | |
| The Radeon R9 270X OC from Gigabyte did good in our
test parkour despite it doesn't have really anything special. The card features a
custom PCB, a little factory overclocking on the GPU and a
great cooling solution. We noticed only one major flaw concerning the
cooling solution that could be quieter. Also Gigabyte could have easily pushed the factory overclocking
further since they equip their card with memory chips
rated at 1'500 MHz. Other than that we like its design and aggressive
pricing. Again we have to point out that the Radeon 200 series is not currently part of the Never Settle Forever program. This may change in the future but at the moment you don't get any game for free buying a Radeon 200 series card unless the manufacturer specifies otherwise. |
- Performance
- Cooling performance - Design - Price |
- Memory Clock
- Noise levels |
|
| Cooling / Noise Level | + | - | |
| For its Radeon R9 270X OC, Gigabyte makes use of a
downscaled version of their WindForce 3X cooler. This version offers
great cooling performance but could be quieter. Indeed the manufacturer
adjusted the fan profile in the BIOS for performance over silence. We
hope Gigabyte will release a BIOS update to change this. In idle the card is very silent and under load it can be described as silent. |
- Cooling performance | - Noise levels | |
| Performance | + | - | |
| In the tested games, the Gigabyte Radeon R9 270X OC is on average
3.15 % faster than a Radeon R9 270X with reference clocks and 10 % faster than
its predecessor the Radeon
HD 7870. A closer look at power consumption shows, that our test system, equipped with the Gigabyte OC, burns 49 Watts under idle conditions and 232 Watts under load. In both cases those are really good results for a R9 270X. Compared to a reference clocked R9 270X, the power consumption of the Gigabyte OC is only 4 % higher. |
- Performance
- Performance/Price - Power consumption under load |
||
| Recommendation / Price | + | - | |
| The Gigabyte OC is one of the cheapest Radeon R9
270X. At the time of the review, the Gigabyte OC can be found at a starting price of 163 Euro and the cheapest offer for a R9 270X
starts at 158 Euros excluding shipping costs accross the EU. Since the graphics card only has a noise issue that can be fixed changing the temperature target via sotfware, we recommend this card for people looking for a cheap and good Radeon R9 270X. |
- Gaming
- Price |
||
| We gave the Radeon R9 270X OC from Gigabyte 4 out of 5 stars. | |||
