 With the X99 WS, ASRock already has an X99 motherboard ready for launch day and this particular model comes with a reasonable feature mix. It doesn't take long until you see that ASRock did not overexaggerat equipping this board with additional chips, which is something that's reflected in the price. Let's have a look then if ASRock did a good job with their X99 WS.
 Article in English Article in English |
 Artikel in Deutsch Artikel in Deutsch |
 Article en français Article en français |
 Articolo in italiano Articolo in italiano |
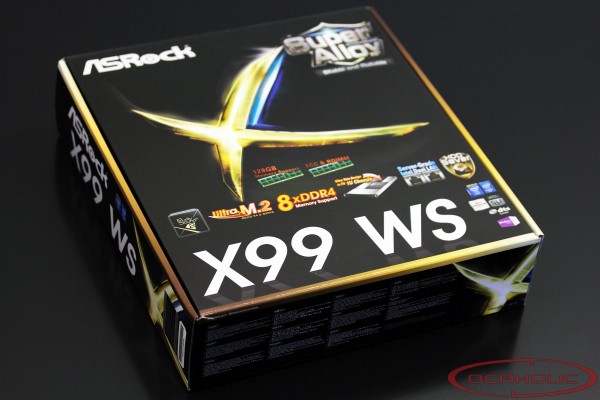
With the X99 WS ASRock is amongst the few motherboard makers that have a new X99 motherboard ready at launch day. Overall this board features a new color scheme as well as a rather reasonable feature mix and we're definitely curious to find out what this board can do.
Specs and Delivery
| Chipset | Intel X99 |
| Memory | Quad Channel DDR4, 8 x DIMM, Max. 64 GB DDR3, 2933+(OC) / 2800(OC) / 2400(OC) / 2133 MHz Non-ECC, Un-buffered Memory |
| Multi-GPU |
|
| Slots |
|
| Sound | Realtek ALC1150 8-Channel High Definition Audio CODEC
|
| Storage |
|
| Network |
|
| Internal Connectors |
|
| Extrenal Connectors |
|
| Forfactor | EATX (30.5 cm x 33.0 cm) |


- Quick Installation Guide
- Support CD
- 1 x I/O Shield
- 2 x ASRock SLI Bridge (2 Slot)
- 1 x ASRock SLI Bridge (3 Slot)
- 1 x ASRock 3-way SLI Bridge
- 4 x Serial ATA Cables
- 1 x HDD Saver Cable
- 1 x Scre for Ultra M.2 Socket
Features
12 + 4 Phase Power Design |
Since quite some time ASRock has been equipping its boards with digital power designs. With the X99 WS they are very proud about their quite complex solution which consists of Dual-Stack MOSFET's (DSM), NextFET MOSFETs and 12K Platinum caps. |
|
Purity Sound 2 |
The ASRock Purity 2 audio solution is based on a Realtek ALC1150 audio codec and features 115dB SNR. It also comes with EMI shielding for the main chip as well as onboard isolation. In order to improve signal quality, the motherboard features excellent Nichicon onboard capacitors. |
 |
M.2 Support |
The new X99 WS motherboard from ASRock features an M.2 slot which is placed between two PCIe slots. This motherboard can be equipped with SSDs in M.2 format and it is wired directly to the X99 PCH via four PCI Express lanes, therefore offering up to 20 Gbps can be pushed over the bus through this slot. |
 |

Layout
At a first glance the ASRock X99 WS leaves a very good impression with its good looking design. The manufacturer decided to go for a combination of black and blue, which suites nicely and in the end you get an aesthetic looking product. The layout itself is well thought and there is for example plenty of space around the CPU socket to install even todays largest CPU coolers. The fact that there are SATA connectors which have been angled by 90 degrees allows for an easy installation of oversized graphics cards. Meanwhile ASRock is using very similarly shaped cooling blocks on all motherboards in order to unify the design language. The only thing that gets changed is the color.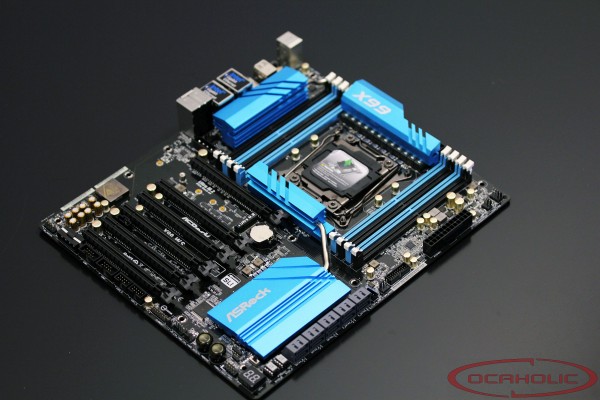
The ASRock X99 WS comes with a digital 12+4 phase power design, whereas the CPU is backed up by twelve phases and the memory by four. Like we've already explained on the features page ASRock is making use of an extensive solution. There are for instance Dual-Stack MOSFETs, NexFET MOSFETs as well as 12K Platinum caps on this motherboard. The Dual-Stack MOSFETs are taking care of stable and efficient current delivery to the CPU and compared to standard MOSFETs the offer a significantly lower RDS(on) value of just 1.2 milliohm. The memory gets backed-up by NexFET MOSFETs, which also offer a very low ROD(on) value of 2.9 milliohm. Last but definitely not least there 12K Platinum Caps that are good for no less than 12'000 hours of on time.

Totally you'll find eight DIMM-slots on the ASRock X99 WS. Officially supported are DDR4, 2933+(OC) / 2800(OC) / 2400(OC) / 2133 MHz. There is engough space between the DIMM-slots and the CPU socket which means that you wont encounter compatibility problems with big coolers even when you choose to install RAM with big heatspreaders. Also supported are Xtreme Memory Profiles (XMP) in version 2.0.

On the X99 WS PCH as well as current converters got separate cooling blocks and also the chips in between CPU socket and first PCI Express 3.0 slot received their own cooling element. ASRock decided to connect PCH and the block between CPU socket and first PCI Express 3.0 slot with a heatpipe and also the two blocks covering the VRM area are connected via a heatpipe. Other than that the weight of this board is quite high, which is also partially due to cooling blocks. Subjectively speaking a high weight is a first indicator for a quality motherboard.


Connectors and I/O
Totally ASRock equipped the X99 WS with ten angled SATA ports. All ports offer 6Gbps bandwidth and they've been wired directly to the X99 PCH. There is also a M.2 x4 expansion slot, which has been connected through four PCI Express 2.0 lanes. If you decide to use the M.2 slot you should keep in mind, that the third full-size PCI Express slot will be deactivated. Overall there is good storage flexibility with the motherboard and workstations as well as rigs for enthusiasts can be equipped with plenty of drives. On this PCB you'll also find practical onboard power- and reset-buttons in the top right corner of the board and there is also a debug display.


Totally you'll find six fan headers on the ASRock X99 WS which is more than enough, to provide a well equipped high-end system or also a workstation with fresh air. The fan headers are located around the CPU socket as well as spread over the motherboard. Unfortunately not all headers offer 4 pins which means that you can't regulate fan speeds in BIOS or Windows for alle fans attached to the board.


Looking at the external connectors directly at the back-panel ASRock equipped the X99 WS with one PS2 mouse/keyboard connector, four USB 3.0/2.0 ports, four USB 2.0/1.1 ports, two gigabit ethernet ports, an eSATA connector as well as an optical out and an analogue audio panel. Furtheremore you'll also find a clear CMOS button.

BIOS
With the most recent version of ASRock's UEFI BIOS, we find a visually more attractive than what you got with the predecessor, but still we would like it to be less flashy. In terms of functionality you can not only monitor system information, CPU and motherboard temperature, CPU voltage and DRAM status but you can also create your own fan profiles for the different PWM headers.


Test setup
Hardware |
|
| Motherboard |
|
| Processor | Intel Core i7-5960X, 3.5 GHz |
| Memory | 16 GB (4x4) G.Skill Ripjaws4 DDR4-3000 MHz CL15-15-15-35-Auto @ DDR4-2133 CL14-14-14-35-2T |
| Graphic card | ASUS GeForce GTX 780 Ti Matrix Platinum |
| Driver | ForceWare 340.52 |
| Hard disk | OCZ Arc 100 SSD 240 GB |
| Power supply | Seasonic Platinum 1050W |
Preview / Gallery
| Product Picture | Link to Gallery |

 |
ASRock X99 WS |

 |
ASUS Rampage V Extreme |

 |
ASUS X99 Deluxe |

 |
EVGA X99 Classified |

 |
Gigabyte X99-UD4 |
3DMark
Ice Storm
| 3DMark Ice Storm Extreme Score |
Review Rating |
Percent | |
| ASUS X99 Deluxe |
 |
160'789 | 102.18 % |
| ASUS Rampage V Extreme |
n/A |
159'987 | 101.67 % |
| ASRock X99 WS |
 |
158'888 | 100.98 % |
| Gigabyte X99-UD4 |
n/A |
158'099 | 100.47 % |
| EVGA X99 Classified |
n/A |
157'365 | 100.00 % |
| more is better | |||
Ice Storm Physics
| 3DMark Ice Storm Physics Score |
Review Rating |
Percent | |
| ASUS Rampage V Extreme |
n/A |
59'650 | 102.16 % |
| ASUS X99 Deluxe |
|
59'635 | 102.13 % |
| ASRock X99 WS |
|
58'910 | 100.89 % |
| Gigabyte X99-UD4 |
n/A |
59'653 | 102.16 % |
| EVGA X99 Classified |
n/A |
58'389 | 100.00 % |
| more is better | |||
Fire Strike
| 3DMark Fire Strike Score |
Review Rating |
Percent | |
| ASUS Rampage V Extreme |
n/A |
5'533 | 100.56 % |
| ASUS X99 Deluxe |
|
5'528 | 100.47 % |
| ASRock X99 WS |
|
5'526 | 100.44 % |
| Gigabyte X99-UD4 |
n/A |
5'516 | 100.25 % |
| EVGA X99 Classified |
n/A |
5'502 | 100.00 % |
| more is better | |||
Fire Strike Physics
| 3DMark Fire Strike Physics Score |
Review Rating |
Percent | |
| ASUS Rampage V Extreme |
n/A |
17'227 | 104.49 % |
| ASUS X99 Deluxe |
|
17'168 | 104.13 % |
| Gigabyte X99-UD4 |
n/A |
17'100 | 100.72 % |
| EVGA X99 Classified |
n/A |
16'487 | 100.00 % |
| ASRock X99 WS |
|
16'453 | 99.79 % |
| more is better | |||
3DMark 11
| 3DMark 11 Total |
Review Rating |
Percent | |
| ASUS X99 Deluxe |
|
15'947 | 103.61 % |
| ASUS Rampage V Extreme |
n/A |
15'922 | 103.44 % |
| ASRock X99 WS |
|
15'777 | 102.50 % |
| Gigabyte X99-UD4 |
n/A |
15'652 | 101.69 % |
| EVGA X99 Classified |
n/A |
15'392 | 100.00 % |
| more is better | |||
CPU
| 3DMark 11 Physics |
Review Rating |
Percent | |
| ASUS X99 Deluxe |
|
15'445 | 101.27 % |
| ASRock X99 WS |
|
15'397 | 100.96 % |
| EVGA X99 Classified |
n/A |
15'251 | 100.00 % |
| ASUS Rampage V Extreme |
n/A |
16'329 | 107.07 % |
| Gigabyte X99-UD4 |
n/A |
15'212 | 99.74 % |
| more is better | |||
3DMark Vantage
| 3DMark Vantage Total |
Review Rating |
Percent | |
| ASUS Rampage V Extreme |
n/A |
50'220 | 102.51 % |
| ASUS X99 Deluxe |
|
50'050 | 102.17 % |
| Gigabyte X99-UD4 |
n/A |
49'756 | 101.57 % |
| ASRock X99 WS |
|
49'415 | 100.87 % |
| EVGA X99 Classified |
n/A |
48'988 | 100.00 % |
| more is better | |||
| 3DMark Vantage CPU |
Review Rating |
Percent | |
| ASUS Rampage V Extreme |
n/A |
51'564 | 102.61 % |
| ASUS X99 Deluxe |
|
51'363 | 102.21 % |
| ASRock X99 WS |
|
50'940 | 101.37 % |
| Gigabyte X99-UD4 |
n/A |
50'899 | 101.29 % |
| EVGA X99 Classified |
n/A |
50'250 | 100.00 % |
| more is better | |||
PC Mark 08
Total
| PC Mark 08 Total |
Review Rating |
Percent | |
| ASUS Rampage V Extreme |
n/A |
4'437 | 103.98 % |
| ASUS X99 Deluxe |
|
4'402 | 103.16 % |
| Gigabyte X99-UD4 |
n/A |
4'390 | 102.88 % |
| ASRock X99 WS |
|
4'290 | 100.54 % |
| EVGA X99 Classified |
n/A |
4'267 | 100.00 % |
| more is better | |||
| Web browsing - JunglePin |
Review Rating |
s | Percent |
| EVGA X99 Classified |
n/A |
0.262 | 100.00 % |
| ASUS Rampage V Extreme |
n/A |
0.288 | 90.97 % |
| ASUS X99 Deluxe |
|
0.288 | 90.97 % |
| Gigabyte X99-UD4 |
n/A |
0.288 | 90.97 % |
| ASRock X99 WS |
|
0.292 | 89.73 % |
| less is better | |||
| Web Browsing Amazonia |
Review Rating |
s | Percent |
| ASUS X99 Deluxe |
|
0.122 | 100.00 % |
| ASRock X99 WS |
|
0.122 | 100.00 % |
| EVGA X99 Classified |
n/A |
0.122 | 100.00 % |
| ASUS Rampage V Extreme |
n/A |
0.122 | 100.00 % |
| Gigabyte X99-UD4 |
n/A |
0.122 | 100.00 % |
| less is better | |||
| Writing |
Review Rating |
s | Percent |
| Gigabyte X99-UD4 |
n/A |
4.11 | 106.81 % |
| ASRock X99 WS |
|
4.27 | 102.81 % |
| ASUS Rampage V Extreme |
n/A |
4.33 | 101.39 % |
| ASUS X99 Deluxe |
|
4.35 | 100.92 % |
| EVGA X99 Classified |
n/A |
4.39 | 100.00 % |
| less is better | |||
| Photo Editing |
Review Rating |
s | Percent |
| ASUS X99 Deluxe |
|
0.283 | 127.67 % |
| ASRock X99 WS |
|
0.283 | 127.67 % |
| ASUS Rampage V Extreme |
n/A |
0.282 | 127.66 % |
| Gigabyte X99-UD4 |
n/A |
0.306 | 117.68 % |
| EVGA X99 Classified |
n/A |
0.360 | 100.00 % |
| less is better | |||
| Video Chat encoding / Video Chat Playback 1 |
Review Rating |
fps | Percent |
| ASUS X99 Deluxe |
|
30.00 | 100.00 % |
| ASRock X99 WS |
|
30.00 | 100.00 % |
| EVGA X99 Classified |
n/A |
30.00 | 100.00 % |
| ASUS Rampage V Extreme |
n/A |
30.00 | 100.00 % |
| Gigabyte X99-UD4 |
n/A |
30.00 | 100.00 % |
| more is better | |||
| Video Chat encoding / Video Chat encoding |
Review Rating |
ms | Percent |
| ASRock X99 WS |
|
42.00 | 102.62 % |
| ASUS X99 Deluxe |
|
42.00 | 102.62 % |
| Gigabyte X99-UD4 |
n/A |
42.00 | 102.62 % |
| EVGA X99 Classified |
n/A |
43.00 | 100.23 % |
| ASUS Rampage V Extreme |
n/A |
43.10 | 106.07 % |
| less is better | |||
| Casual Gaming |
Review Rating |
fps | Percent |
| ASUS X99 Deluxe |
|
110.1 | 101.10 % |
| ASUS Rampage V Extreme |
n/A |
109.7 | 100.73 % |
| ASRock X99 WS |
|
109.3 | 100.38 % |
| EVGA X99 Classified |
n/A |
108.9 | 100.00 % |
| Gigabyte X99-UD4 |
n/A |
108.4 | 99.54 % |
| more is better | |||
Arithmetic Benchmark
| SiSoft Sandra - Arithmetic Benchmark - Dhrystone |
Review Rating |
GIPS | Percent |
| Gigabyte X99-UD4 |
n/A |
241.24 | 100.31 % |
| ASUS X99 Deluxe |
|
240.80 | 100.13 % |
| ASRock X99 WS |
|
240.14 | 99.85 % |
| EVGA X99 Classified |
n/A |
240.49 | 100.00 % |
| ASUS Rampage V Extreme |
n/A |
240.69 | 99.95 % |
| more is better | |||
| SiSoft Sandra - Arithmetic Benchmark - Whetstone |
Review Rating |
GFLOPS | Percent |
| ASUS X99 Deluxe |
|
190.28 | 100.43 % |
| ASUS Rampage V Extreme |
n/A |
189.70 | 100.13 % |
| EVGA X99 Classified |
n/A |
189.46 | 100.00 % |
| ASRock X99 WS |
|
189.37 | 99.95 % |
| Gigabyte X99-UD4 |
n/A |
186.84 | 98.66 % |
| more is better | |||
Multimedia
| SiSoft Sandra - Multimedia - Integer |
Review Rating |
MPixels/sec | Percent |
| ASUS X99 Deluxe |
|
452.13 | 105.10 % |
| ASUS Rampage V Extreme |
n/A |
451.25 | 104.90 % |
| Gigabyte X99-UD4 |
n/A |
442.67 | 102.90 % |
| ASRock X99 WS |
|
435.72 | 101.29 % |
| EVGA X99 Classified |
n/A |
430.18 | 100.00 % |
| more is better | |||
| SiSoft Sandra - Multimedia - Floating Point |
Review Rating |
MPixels/sec | Percent |
| ASUS Rampage V Extreme |
n/A |
446.67 | 104.92 % |
| ASUS X99 Deluxe |
|
446.00 | 104.76 % |
| Gigabyte X99-UD4 |
n/A |
428.81 | 100.72 % |
| ASRock X99 WS |
|
427.82 | 100.49 % |
| EVGA X99 Classified |
n/A |
425.74 | 100.00 % |
| more is better | |||
Crytography
| SiSoft Sandra - Crytography - AES 256 |
Review Rating |
GB/sec | Percent |
| ASUS Rampage V Extreme |
n/A |
14.45 | 105.24 % |
| ASUS X99 Deluxe |
|
14.44 | 105.17 % |
| ASRock X99 WS |
|
14.25 | 103.79 % |
| EVGA X99 Classified |
n/A |
13.73 | 100.00 % |
| Gigabyte X99-UD4 |
n/A |
13.50 | 98.18 % |
| more is better | |||
| SiSoft Sandra - Crytography - SHA 256 |
Review Rating |
GB/sec | Percent |
| ASUS X99 Deluxe |
|
9.26 | 100.32 % |
| ASUS Rampage V Extreme |
n/A |
9.25 | 100.22 % |
| ASRock X99 WS |
|
9.25 | 100.22 % |
| EVGA X99 Classified |
n/A |
9.23 | 100.00 % |
| Gigabyte X99-UD4 |
n/A |
9.18 | 98.59 % |
| more is better | |||
SiSoft Sandra 2
Memory bandwidth
| SiSoft Sandra - Memory bandwidth - Integer |
Review Rating |
GB/sec | Percent |
| ASUS Rampage V Extreme |
n/A |
46.61 | 104.74 % |
| ASUS X99 Deluxe |
|
46.59 | 104.70 % |
| ASRock X99 WS |
|
46.52 | 104.54 % |
| EVGA X99 Classified |
n/A |
44.50 | 100.00 % |
| Gigabyte X99-UD4 |
n/A |
43.23 | 97.15 % |
| more is better | |||
| SiSoft Sandra - Memory bandwidth - floating point |
Review Rating |
GB/sec | Percent |
| ASUS X99 Deluxe |
|
47.68 | 105.96 % |
| ASUS Rampage V Extreme |
n/A |
47.20 | 104.89 % |
| ASRock X99 WS |
|
47.15 | 104.78 % |
| Gigabyte X99-UD4 |
n/A |
45.69 | 101.53 % |
| EVGA X99 Classified |
n/A |
45.00 | 100.00 % |
| more is better | |||
Memory latency
| SiSoft Sandra - Memory latency |
Review Rating |
ns | Percent |
| ASRock X99 WS |
|
27.4 | 100.00 % |
| EVGA X99 Classified |
n/A |
27.4 | 100.00 % |
| ASUS X99 Deluxe |
|
27.7 | 98.92 % |
| ASUS Rampage V Extreme |
n/A |
27.8 | 96.56 % |
| Gigabyte X99-UD4 |
n/A |
30.0 | 91.33 % |
| less is better | more is better | ||
Memory and cache access
| SiSoft Sandra - Memory and cache access |
Review Rating |
GB/sec | Percent |
| ASUS Rampage V Extreme |
n/A |
351.65 | 104.79 % |
| ASUS X99 Deluxe |
|
351.58 | 104.77 % |
| ASRock X99 WS |
|
341.54 | 101.78 % |
| Gigabyte X99-UD4 |
n/A |
336.21 | 100.19 % |
| EVGA X99 Classified |
n/A |
335.56 | 100.00 % |
| more is better | |||
UC Bench
| UC Bench |
Review Rating |
PW/sec | Percent |
| ASUS Rampage V Extreme |
n/A |
1801.8 | 102.41 % |
| ASUS X99 Deluxe |
|
1801.2 | 102.38 % |
| Gigabyte X99-UD4 |
n/A |
1798.3 | 102.21 % |
| ASRock X99 WS |
|
1764.9 | 100.31 % |
| EVGA X99 Classified |
n/A |
1759.4 | 100.00 % |
| more is better | |||
Super Pi 1M - 32M
Super Pi 1M
| SuperPi 1.5 XS - 1M |
Review Rating |
sec | Percent |
| ASUS Rampage V Extreme |
n/A |
10.250 | 102.87 % |
| ASRock X99 WS |
|
10.389 | 101.49 % |
| Gigabyte X99-UD4 |
n/A |
10.410 | 101.29 % |
| ASUS X99 Deluxe |
|
10.431 | 101.08 % |
| EVGA X99 Classified |
n/A |
10.544 | 100.00 % |
| less is better | more is better | ||
Super Pi 32M
| SuperPi 1.5 XS - 32M |
Review Rating |
sec | Percent |
| ASUS Rampage V Extreme |
n/A |
541'812 | 100.65 % |
| ASRock X99 WS |
|
542.320 | 100.55 % |
| ASUS X99 Deluxe |
|
542'437 | 100.53 % |
| EVGA X99 Classified |
n/A |
545'313 | 100.00 % |
| Gigabyte X99-UD4 |
n/A |
553.569 | 98.51 % |
| less is better | more is better | ||
wPrime 1024M Multicore
| wPrime - 1024M Multi Core |
Review Rating |
sec | Percent |
| ASUS Rampage V Extreme |
n/A |
103'999 | 102.46 % |
| ASUS X99 Deluxe |
|
104'047 | 102.41 % |
| Gigabyte X99-UD4 |
n/A |
104.506 | 101.96 % |
| ASRock X99 WS |
|
104.555 | 101.91 % |
| EVGA X99 Classified |
n/A |
106'554 | 100.00 % |
| less is better | more is better | ||
Cinebench R15
Cinebench R11.5 - Multi Core
| Cinebench R15 - Multi Core |
Review Rating |
pts | Percent |
| ASUS X99 Deluxe |
|
1'402 | 105.33 % |
| ASUS Rampage V Extreme |
n/A |
1'396 | 104.88 % |
| Gigabyte X99-UD4 |
n/A |
1'381 | 103.76 % |
| ASRock X99 WS |
|
1'339 | 100.60 % |
| EVGA X99 Classified |
n/A |
1'331 | 100.00 % |
| less is better | more is better | ||
Tomb Raider
Low resolution, low details
| Tomb Raider (low resolution, low details) |
Review Rating |
fps | Percent |
| ASUS Rampage V Extreme |
n/A |
724.30 | 101.09 % |
| ASUS X99 Deluxe |
|
723.00 | 100.91 % |
| ASRock X99 WS |
|
718.60 | 100.29 % |
| EVGA X99 Classified |
n/A |
716.50 | 100.00 % |
| Gigabyte X99-UD4 |
n/A |
689.80 | 96.27 % |
| more is better | |||
High resolution, high details
| Tomb Raider (high resolution, high details) |
Review Rating |
fps | Percent |
| ASRock X99 WS |
|
52.3 | 100.38 % |
| ASUS Rampage V Extreme |
n/A |
52.3 | 100.38 % |
| ASUS X99 Deluxe |
|
52.2 | 100.19 % |
| EVGA X99 Classified |
n/A |
52.1 | 100.00 % |
| Gigabyte X99-UD4 |
n/A |
52.0 | 99.81 % |
| more is better | |||
Metro Last Light
Low resolution, low details
| Metro Last Light (low details, low resolution) |
Review Rating |
fps | Percent |
| ASRock X99 WS |
|
202.81 | 101.28 % |
| ASUS X99 Deluxe |
|
202.12 | 100.93 % |
| ASUS Rampage V Extreme |
n/A |
201.98 | 100.86 % |
| EVGA X99 Classified |
n/A |
200.25 | 100.00 % |
| Gigabyte X99-UD4 |
n/A |
199.98 | 99.87 % |
| more is better | |||
High resolution, high details
| Metro Last Light (high details, high resolution) |
Review Rating |
fps | Percent |
| ASUS X99 Deluxe |
|
64.93 | 100.51 % |
| ASUS Rampage V Extreme |
n/A |
64.88 | 100.43 % |
| ASRock X99 WS |
|
64.85 | 100.39 % |
| EVGA X99 Classified |
n/A |
64.60 | 100.00 % |
| Gigabyte X99-UD4 |
n/A |
64.57 | 99.95 % |
| more is better | |||
Thief
Low resolution, low details
| Thief (low details, low resolution) |
Review Rating |
fps | Percent |
| ASUS Rampage V Extreme |
n/A |
138.4 | 103.51 % |
| ASUS X99 Deluxe |
|
138.3 | 103.44 % |
| ASRock X99 WS |
|
135.1 | 101.08 % |
| Gigabyte X99-UD4 |
n/A |
134.5 | 100.60 % |
| EVGA X99 Classified |
n/A |
133.7 | 100.00 % |
| more is better | |||
High resolution, high details
| Thief (high details, high resolution) |
Review Rating |
fps | Percent |
| ASUS Rampage V Extreme |
n/A |
84.4 | 102.55 % |
| ASUS X99 Deluxe |
|
83.1 | 100.97 % |
| ASRock X99 WS |
|
82.6 | 100.36 % |
| Gigabyte X99-UD4 |
n/A |
82.4 | 100.12 % |
| EVGA X99 Classified |
n/A |
82.3 | 100.00 % |
| more is better | |||
Right Mark Audio Analyzer
| Frequency Response |
Review Rating |
Overall | |
| Gigabyte X99-UD4 |
n/A |
+0.26, +0.12 | Excellent |
| ASUS X99 Deluxe |
|
+0.44, +0.06 | Very good |
| ASUS Rampage V Extreme |
n/A |
+0.20, +0.12 | Good |
| ASRock X99 WS |
|
+0.50, +0.09 | Good |
| EVGA X99 Classified |
n/A |
+.047, -1.51 | Average |
| less is better | |||
| Noise Level, dB (A) |
Review Rating |
Overall | |
| ASUS X99 Deluxe |
|
-94.6 | Very good |
| EVGA X99 Classified |
n/A |
-90.2 | Very good |
| ASRock X99 WS |
|
-88.9 | Good |
| Gigabyte X99-UD4 |
n/A |
-84.8 | Good |
| ASUS Rampage V Extreme |
n/A |
-84.6 | Good |
| less is better | more is better | ||
| Dynamic Range |
Review Rating |
Overall | |
| ASUS X99 Deluxe |
|
94.4 | Very good |
| EVGA X99 Classified |
n/A |
90.2 | Very good |
| ASRock X99 WS |
|
88.8 | Good |
| ASUS Rampage V Extreme |
n/A |
84.7 | Good |
| Gigabyte X99-UD4 |
n/A |
84.5 | Good |
| more is better | |||
| Total Harmonic Distortion (THD) |
Review Rating |
Overall | |
| ASUS X99 Deluxe |
|
6.169 | Very good |
| ASUS Rampage V Extreme |
n/A |
0.019 | Good |
| ASRock X99 WS |
|
0.212 | Poor |
| Gigabyte X99-UD4 |
n/A |
2.899 | Very poor |
| EVGA X99 Classified |
n/A |
23.919 | Very poor |
| less is better | |||
| THD + Noise |
Review Rating |
Overall | |
| ASUS X99 Deluxe |
|
-21.9 | Very good |
| ASUS Rampage V Extreme |
n/A |
-71.3 | Average |
| ASRock X99 WS |
|
-48.2 | Poor |
| Gigabyte X99-UD4 |
n/A |
-28.8 | Very poor |
| EVGA X99 Classified |
n/A |
-9.9 | Very poor |
| less is better | |||
| IMD + Noise |
Review Rating |
Overall | |
| ASUS Rampage V Extreme |
n/A |
0.026 | Good |
| ASRock X99 WS |
|
0.429 | Poor |
| Gigabyte X99-UD4 |
n/A |
1.115 | Poor |
| ASUS X99 Deluxe |
|
3.710 | Poor |
| EVGA X99 Classified |
n/A |
21.186 | Very poor |
| less is better | |||
| Stereo Crosstalk |
Review Rating |
Overall | |
| ASUS X99 Deluxe |
|
-92.4 | Exellent |
| ASRock X99 WS |
|
-85.8 | Exellent |
| Gigabyte X99-UD4 |
n/A |
-83.7 | Very good |
| EVGA X99 Classified |
n/A |
-83.9 | Very good |
| ASUS Rampage V Extreme |
n/A |
-83.1 | Very good |
| less is better | |||
| IMD at 10kHz |
Review Rating |
Overall | |
| ASUS Rampage V Extreme |
n/A |
0.020 | Very good |
| ASRock X99 WS |
|
0.453 | Poor |
| Gigabyte X99-UD4 |
n/A |
1.176 | Poor |
| ASUS X99 Deluxe |
|
3.089 | Poor |
| EVGA X99 Classified |
n/A |
24.226 | Very poor |
| less is better | |||
[pagebreak]
BCLK Overclocking[frBCLK Overclocking[/fr]
Idle
| Idle |
Review Rating |
MHz | Percent |
| ASUS Rampage V Extreme |
n/A |
179 | 105.29 % |
| ASUS X99 Deluxe |
|
178 | 104.71 % |
| ASRock X99 WS |
|
176 | 103.53 % |
| Gigabyte X99-UD4 |
n/A |
175 | 102.94 % |
| EVGA X99 Classified |
n/A |
170 | 100.00 % |
| less is better | more is better | ||
Power Consumption
Idle
| Idle |
Review Rating |
Watt | Percent |
| ASRock X99 WS |
|
81.15 | 127.11 % |
| Gigabyte X99-UD4 |
n/A |
81.60 | 126.41 % |
| ASUS X99 Deluxe |
|
91.40 | 112.86 % |
| EVGA X99 Classified |
n/A |
103.15 | 100.00 % |
| ASUS Rampage V Extreme |
n/A |
105.14 | 98.11 % |
| less is better | more is better | ||
Load
| Load |
Review Rating |
Watt | Percent |
| ASUS X99 Deluxe |
|
178.20 | 106.99 % |
| ASRock X99 WS |
|
179.75 | 106.97 % |
| Gigabyte X99-UD4 |
n/A |
186.77 | 102.08 % |
| EVGA X99 Classified |
n/A |
190.65 | 100.00 % |
| ASUS Rampage V Extreme |
n/A |
202.67 | 94.07 % |
| less is better | more is better | ||
Performance Rating
| 3D and Gaming Benchmarks |
Review Rating |
Percent |
| ASUS Rampage V Extreme |
n/A |
102.38 % |
| ASUS X99 Deluxe |
|
101.85 % |
| ASRock X99 WS |
|
100.83 % |
| Gigabyte X99-UD4 |
n/A |
100.32 % |
| EVGA X99 Classified |
n/A |
100.00 % |
| more is better | ||
| 2D Benchmarks |
Review Rating |
Percent |
| ASUS Rampage V Extreme |
n/A |
103.06 % |
| ASUS X99 Deluxe |
|
102.98 % |
| ASRock X99 WS |
|
101.97 % |
| Gigabyte X99-UD4 |
n/A |
100.95 % |
| EVGA X99 Classified |
n/A |
100.00 % |
| more is better | ||
| Performance per Watt |
Review Rating |
Percent |
| ASRock X99 WS |
|
86.64 % |
| Gigabyte X99-UD4 |
n/A |
88.09 % |
| ASUS X99 Deluxe |
|
93.18 % |
| EVGA X99 Classified |
n/A |
100.00 % |
| ASUS Rampage V Extreme |
n/A |
106.93 % |
| less is better | ||
Price comparison
| Model |
Geizhals.eu |
| ASUS X99 Deluxe |
|
| ASRock X99 WS |
|
| ASUS Rampage V Extreme |
|
| EVGA X99 Classified |
|
| Gigabyte X99 SOC Force |
|
| Gigabyte X99 UD4 |
|
Conclusion
| Allgemein | + | - | |
| With the X99 WS ASRock has a solid motherboard in it's portfolio, which is based on Intels latest X99 chipset. Having a closer look at the features mix reveals there have quite a few reasonable choices been made. Which is why here and there you see that ASRock has actually been holding back installing another and yet another additional chip. Nevertheless we would have liked to find a few more USB 3.0 ports at the back panel for example. On another note there are no SATA Express ports on this board. These days there are virtually no SATA Express devices available, which can be seen as a justification for not equipping the board with such ports. | -
Design - Layout |
||
| Layout | + | - | |
|
The ASRock X99 WS's layout has been very well thought. Once more practical are the angled SATA connectors as well as the power- and reset-buttons. There is also a debug display which is very useful in case you should have issues with a component in your system or the board itself. Apart from that the placement of the PCI-Express x16 slots is very well chosen. There is a total of five full sized PCI Express slots and between the first two PCI Express x16 slots there is a M.2 x4 slot. Should you want to do that, you can go ahead and build a quad-GPU system using this board as a basis. |
- Angled SATA connectors
- 5 x Full-Size PCI Express x16 - Power/Reset-Button onboard - Debug display - Space around the CPU socket - M.2 x4 |
- No SATA Express | |
| Performance | + | - | |
| Let's have closer look at overall 3D performance. Calcualting the average of all 3D benchmarks we ran, we see that this board comes in third. Concerning the average of all 2D benchmarks we ran, this board again reaches third position. At this point we're quite sure, ASRock is capable of getting some more performance out of this motherboard and we're looking forward to finding BIOS updates on ASRocks files servers. On another note we had a look at power consumption and it turns out that this board is quite a bit more power efficient than the competition. | - Power consumption | - 3DMark Fire Strike Physics | |
| Overclocking / BIOS | + | - | |
| The BIOS of the X99 WS is identical from what you get with other recent ASRock motherboards these days. This means the basic structure and also the design has not been changed apart from the color scheme. Overall the structure is easy to understand and even if you're not a very experienced user you will find the things you'd like to change. On another note it's always interesting to see how mature a BIOS is before a prodcut launch. ASRock did a pretty good job with this on but still, every here and there the performance could be improved. | - Clear arrangement - Sheer amount of options | ||
| Recommendation | + | - | |
| The ASRock X99 WS is most certainly going to be one of the more affordable X99 motherboards. So far we only find this model listed at Caseking for a price of 295 Euro. We're quite sure the prices will drop by quite a margin during the first weeks after launch and in that case this will be a very reasonable choice. Should you be looking for a new X99 motherboard for your workstation, considering the X99 WS from ASRock is definitely no mistake. | -
Workstation - Enthusiast |
||
| Rating | |||
| We give the ASRock X99 WS very good 4.5 out of 5 stars. | |||

Author: m.buechel@ocaholic.ch