Gigabyte is amongst the select NVIDIA board partners that offer new Maxwell based high-end graphics cards from day one. The GTX 960 G1 Gaming ships with Gigabyte's latest Windforce cooler, which should be well capable of keeping the card cool at low temperatures. Apart from that there is a custom design PCB, so this pixel cannon looks like a really interesting contender.
Presentation
Gigabyte is one of the first Nvidia add-in-card (AIC) partners that have
decided to introduce a new custom GTX 960 graphics card that will use NVIDIAs
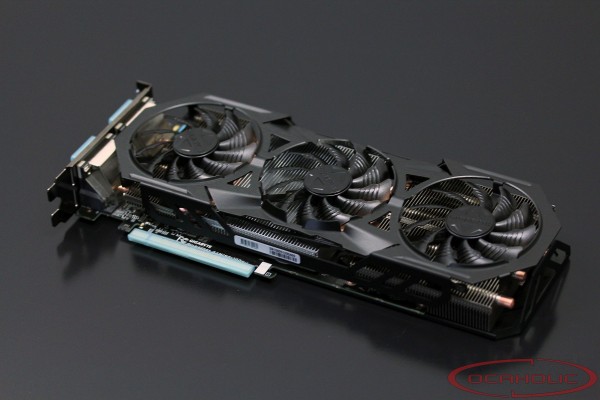
latest and greatest GM206 chip. For this graphics card, Gigabyte makes use of a custom PCB
paired up with its own custom Windforce 3X 300W cooler and on the flip-side of
the card, there is a backplate with G1 Gaming design. A quick look at the specs
also reveals that the card ships factory overclocked.
As always before the launch of a
new chip generation from NVIDIA there have been loads of rumors on the specs
before the launch. Browsing the specifications of this card we find 1024 CUDA
cores, 85 TMUs and 32 ROPs. Looking for reference clocks we find 1'126 MHz core clock and 1'178 MHz boost
clock.
As you can see from the GPU-Z screenshot below, Gigabyte decided to use a
rather beefy high factory-overclock on the new GTX 960 G1 Gaming. While the reference GTX
960 with GM206 GPU is set to work at 1'126 MHz for the base clock and 1'178 MHz
for the GPU Boost clock, the Gigabyte GTX 960 G1 Gaming runs at
1'241 MHz core clock and 1'392 MHz boost clock.
When it comes to memory clock speeds we see a tiny, 12 MHz frequency boost,
which makes the chips run at 7'012 MHz. Combine this with a 128 Bit memory
interface and you end up with a total of over 112 Gigabyte of memory bandwidth,
the Samsung memory on the new GTX 960 can be overclocked by factoy to at least
1800MHz instead of 1750MHz without any issue.
While the typical boost clock is set at 1'178 MHz, the maximum boost of 1'392 MHz
was achieved quite easily and the GTX 960 G1 Gaming held that clock most of
the load time due to the capable Windforce 3X 300W cooler as well as good TDP target
(nVidia's Boost technology being power-based and not temperature-based on this
card). At this point we also run Furmark to see how high the card overclocks,
when the GPU is under full load. This way we can determine a worst case scenario
regarding maximum boost clock. With the card we see clocks speeds of 1'392 MHz
at 1.2v.
Specifications
|
Gigabyte G1 Gaming GTX 960 |
GeForce GTX 960 |
ASUS GTX 960 STRIX OC Edition |
GeForce GTX 760 |
|
Chip |
GM206-300-A1 |
GM206-300-A1 |
GM206-300-A1 |
GK104 Kepler |
|
Process |
28 nm |
28 nm |
28 nm |
28 nm |
|
Transistors |
2.94 billion |
2.94 billion |
2.94 billion |
3.54 billion |
|
GPU clock |
1'241 MHz |
1'126 MHz |
1'253 MHz |
960 MHz |
|
GPU Boost clock |
1'392 MHz |
1'178 MHz |
1'404 MHz |
1'033 MHz |
|
Memory GDDR5 |
2'048 MB |
2'048 MB |
2'048 MB |
2'048 MB |
|
Memory clock |
1'703 (7'012) MHz |
1'750 (7'010) MHz |
1'800 (7'200) MHz |
1'500 (6'000) MHz |
|
Memory interface |
128 Bit |
128 Bit |
128 Bit |
256 Bit |
|
Memory bandwidth |
112'200 MB/s |
112'160 MB/s |
115'200 MB/s |
192'200 MB/s |
| TMUs |
85 |
85 |
85 |
96 |
| Shader Cores |
1024 |
1024 |
1024 |
1'152 |
| ROPs |
32 |
32 |
32 |
32 |
| TDP |
160 Watt |
120 Watt |
120 Watt |
170 Watt |
|
Slots |
2 |
2 |
2 |
Reference Design |
|
Cooler |
WindForce 3X
300W |
NVIDIA Reference |
DirectCU II |
NVIDIA Reference |
[pagebreak]
The card
Gigabyte decided to equip their new GeForce GTX 960 G1 Gaming with the
latest version of their own cooler, which is called WindForce 3X 300W. It
features four 6mm copper heatpipes. Soldered to the heatpipes, there is a large and dense fin
stack which is being cooled by three 80mm fans.
Overall the cooler is well built and compared to the predecessor the copper base
plate is more even that what it looked like on the GTX 760. Nevertheless the
number of heatpipes has been reduced by one. Meanwhile also Gigabyte implemented
a feature that makes the fans turn off as long as there is low load on the GPU.
If the temperature drops below 43°C or GPUs power consumption is lower than
32W the fans are deactivated. If the GPU hits 62°C or if the power consumption of
the chips is higher than 60 Watts, then the fans are there for active cooling.
Another closer look at the cooler reveals that there is a large coper plate, which
helps distributing heat evenly to the numerous heatpipes. Sticking to the copper
plate we find thermal pads, which are touching the memory chips and VRM area.


The Gigabyte G1 Gaming GTX 960 graphics card, or to be precise our sample of
it, allowed a maximum stable overclock of 1'550 MHz
for the GPU and 2'050 MHz on the memory side. We used Furemark V1.11.0 Geeks3D
benchmark with 15 minutes duration and 3DMark Fire Strike Extreme With these clocks we had to feed the GPU
with 1.25 Volts and the memory ran at stock voltages.
A closer look at the PCB shows that Gigabyte equipped its card with an 6+1
phase power design. The GPU gets its current from six phases (NCP81174) and on
additional phase (NCP5239) is there to handle the memory.
The memory chips on the Gigabyte G1 Gaming GTX 960 come from Samsung and carry the
model number K4G41325FC-HC28. They are specified to run at 1'750 MHz (7000 MHz
effective).
[pagebreak]
Photo Gallery
Delivery
The new GTX 960 G1 Gaming graphics card ships well bolstered in a foam made
mold. Bundled with the graphics card you find a driver disc and two power
converters Molex to PCIe-6pin as well as a small manual.
[pagebreak]
Test Setup
|
Motherboard |
- ASUS Maximus VII Hero (BIOS 0224)
|
| CPU |
- Intel Core i7-4770K @ 4.0 GHz (Turbo On / HT On)
|
|
Memory |
- G.Skill Ares Dual Channel 2x8GB @ CL11-12-11-28-1T-Auto DDR3-1600 MHz
|
|
Graphics Cards |
- AMD Radeon R9 280X
- AMD Radeon R9 290X
- AMD Radeon R9 290
- ASUS Radeon R9 290 DirectCU II OC
- ASUS Radeon R9 290X Matrix Platinum
- ASUS Strix OC Edition GeForce GTX 960
- ASUS Strix OC Edition GeForce GTX 980
- ASUS GeForce GTX 980 Matrix Platinum
- ASUS GeForce GTX 980 Poseidon Platinum
- Gigabyte G1 Gaming GeForce GTX 960
- Gigabyte G1 Gaming GeForce GTX 980
- MSI GTX 980 Gaming 4G
- nVidia GeForce GTX 680
- nVidia GeForce GTX 780
- nVidia GeForce GTX 780 Ti
- nVidia GeForce GTX 970
- nVidia GeForce GTX 980
- nVidia GeForce GTX TITAN
- PowerColor Radeon R9 285 TurboDuo
|
| Drivers |
- Windows 7 x64 (up to date)
- NVIDIA ForceWare 344.11
- AMD Catalyst 14.7
|
| Games |
|
|
Games and OS |
- Windows 7 x64
- All
games were up to date on the
|
|
System Drive |
|
|
PSU |
- Seasonic Platinum SS-1000XP / 1000 Watts
|
[pagebreak]
3DMark - Fire Strike

|
Performance, 1920x1080 (1080p) |
Score |
Graphics Score |
% |
| ASUS
GeForce GTX 980 Matrix Platinum |
11'890 |
14'328 |
137.60 % |
|
Gigabyte G1 Gaming GeForce GTX 980 |
11'774 |
14'204 |
136.26 % |
| MSI
GTX 980 Gaming 4G |
11'550 |
13'846 |
133.67 % |
| ASUS
GeForce GTX 980 Poseidon Platinum |
11'423 |
13'720 |
132.20 % |
| ASUS
Strix OC Edition GeForce GTX 980 |
11'392 |
13'627 |
131.84 % |
| nVIDIA
GeForce GTX 980 |
11'202 |
13'414 |
129.64 % |
| nVidia
GeForce GTX 780 Ti |
10'487 |
12'212 |
132.94 % |
| ASUS
Radeon R9 290X Matrix Platinum |
9'851 |
11'506 |
114.00 % |
| AMD
Radeon R9 290X |
9'650 |
11'207 |
111.68 % |
| nVidia
GeForce GTX TITAN |
9'440 |
10'841 |
109.25 % |
| nVidia
GeForce GTX 970 |
9'346 |
10'814 |
108.16 % |
| ASUS
Radeon R9 290 DirectCU II OC |
9'120 |
10'586 |
105.54 % |
| AMD
Radeon R9 290 |
8'927 |
10'237 |
103.31 % |
| nVidia
GeForce GTX 780 |
8'641 |
9'758 |
100.00 % |
| AMD
Radeon R9 280X |
7'233 |
8'020 |
83.71 % |
|
PowerColor Radeon R9 285 TurboDuo |
6'970 |
7'891 |
80.66 % |
| ASUS
Strix OC Edition GeForce GTX 960 |
6'760 |
7'695 |
78.23 % |
| nVidia
GeForce GTX 680 |
6'754 |
7'526 |
78.16 % |
|
Gigabyte G1 Gaming GeForce GTX 960 |
6'671 |
7'593 |
77.20 % |
| |
More is better |
|
Extreme, 2560x1440 (1440p) |
Score |
Graphics Score |
% |
| ASUS GeForce GTX 980 Matrix Platinum |
6'038 |
6'420 |
137.92 % |
| Gigabyte G1 Gaming GeForce GTX 980 |
6'034 |
6'439 |
137.83 % |
| MSI GTX 980 Gaming 4G |
5'908 |
6'273 |
134.95 % |
| ASUS GeForce GTX 980 Poseidon Platinum |
5'810 |
6'176 |
132.71 % |
| ASUS Strix OC Edition GeForce GTX 980 |
5'809 |
6'174 |
132.69 % |
| nVIDIA GeForce
GTX 980 |
5'713 |
6'023 |
130.49 % |
| nVidia GeForce GTX 780 Ti |
5'351 |
5'641 |
122.22 % |
| ASUS Radeon R9 290X Matrix Platinum |
4'880 |
5'117 |
111.47 % |
| nVidia GeForce GTX TITAN |
4'810 |
5'034 |
109.87 % |
| AMD Radeon R9 290X |
4'720 |
5'068 |
107.81 % |
| nVidia GeForce GTX 970 |
4'718 |
4'917 |
107.77 % |
| ASUS Radeon R9 290 DirectCU II OC |
4'420 |
4'518 |
100.96 % |
| nVidia GeForce GTX 780 |
4'378 |
4'554 |
100.00 % |
| AMD Radeon R9 290 |
4'297 |
4'449 |
98.15 % |
| AMD Radeon R9 280X |
3'580 |
3'681 |
81.77 % |
| ASUS Strix OC Edition GeForce GTX 960 |
3'499 |
3'653 |
79.92 % |
|
PowerColor Radeon R9 285 TurboDuo |
3'472 |
3'624 |
79.31 % |
| Gigabyte G1 Gaming GeForce GTX 960 |
3'375 |
3'521 |
77.09 % |
| nVidia GeForce GTX 680 |
3'336 |
3'480 |
76.20 % |
| |
More is better |
|
Ultra, 3840x2160 (2160p) |
Score |
Graphics Score |
% |
| ASUS GeForce GTX 980 Matrix Platinum |
3'214 |
3'171 |
146.76 % |
| Gigabyte G1 Gaming GeForce GTX 980 |
3'209 |
3'162 |
146.53 % |
| MSI GTX 980 Gaming 4G |
3'148 |
3'100 |
143.74 % |
| ASUS GeForce GTX 980 Poseidon Platinum |
3'099 |
3'058 |
141.51 % |
| ASUS Strix OC Edition GeForce GTX 980 |
3'072 |
3'020 |
140.27 % |
| nVIDIA GeForce GTX 980 |
2'988 |
2'954 |
136.44 % |
| ASUS Radeon R9 290X Matrix Platinum |
2'784 |
2'799 |
127.12 % |
| nVidia GeForce GTX 780 Ti |
2'585 |
2'551 |
118.04 % |
| AMD Radeon R9 290X |
2'584 |
2'556 |
117.99 % |
| ASUS Radeon
R9 290 DirectCU II OC |
2'502 |
2'465 |
114.25 % |
| AMD
Radeon R9 290 |
2'437 |
2'383 |
111.28 % |
| nVidia GeForce GTX 970 |
2'420 |
2'347 |
110.50 % |
| nVidia GeForce GTX TITAN |
2'419 |
2'359 |
110.46 % |
| nVidia GeForce GTX 780 |
2'190 |
2'131 |
100.00 % |
| AMD Radeon R9 280X |
1'943 |
1'894 |
88.72 % |
|
PowerColor Radeon R9 285 TurboDuo |
1'281 |
1'168 |
58.49 % |
| ASUS Strix OC Edition GeForce
GTX 960 |
1'058 |
927 |
48.31 % |
| Gigabyte G1 Gaming GeForce GTX 960 |
1'032 |
924 |
47.12 % |
| nVidia GeForce GTX 680 |
724 |
607 |
33.06 % |
| |
More is better |
[pagebreak]
Unigine Heaven 4.0 Extreme Preset

| High Preset, 1920x1080 (1080p) |
Score |
Average FPS |
% |
| ASUS GeForce GTX 980 Matrix Platinum |
2'261 |
89.9 |
122.28 % |
| Gigabyte G1 Gaming GeForce GTX 980 |
2'254 |
89.5 |
121.90 % |
| ASUS GeForce GTX 980 Poseidon Platinum |
2'250 |
89.3 |
121.69 % |
| nVidia GeForce GTX 780 Ti |
2'249 |
89.2 |
121.63 % |
| MSI GTX 980 Gaming 4G |
2'229 |
88.5 |
120.55 % |
| ASUS Strix OC Edition GeForce GTX 980 |
2'189 |
86.9 |
118.39 % |
| nVIDIA GeForce GTX 980 |
2'131 |
84.6 |
115.25 % |
| ASUS Radeon R9 290X Matrix Platinum |
1'983 |
80.3 |
107.25 % |
| AMD Radeon R9 290X |
1'955 |
78.9 |
105.73 % |
| nVidia GeForce GTX TITAN |
1'866 |
74.1 |
100.92 % |
| nVidia GeForce GTX 780 |
1'849 |
73.4 |
100.00 % |
| ASUS Radeon R9 290 DirectCU II OC |
1'829 |
72.6 |
98.92 % |
| AMD Radeon R9 290 |
1'728 |
68.6 |
93.46 % |
| nVidia GeForce GTX 970 |
1'705 |
67.7 |
92.21 % |
| AMD Radeon R9 280X |
1'348 |
53.5 |
72.90 % |
| ASUS Strix OC Edition GeForce GTX 960 |
963 |
43.4 |
52.08 % |
| Gigabyte G1 Gaming GeForce GTX 960 |
952 |
43.2 |
51.49 % |
|
PowerColor Radeon R9 285 TurboDuo |
889 |
35.4 |
48.08 % |
| nVidia GeForce GTX 680 |
888 |
35.3 |
48.03 % |
| |
More is better |
|
High Preset, 2560x1440 (1440p) |
Score |
Average FPS |
% |
| ASUS GeForce GTX 980 Matrix Platinum |
1'290 |
51.4 |
123.92 % |
| nVidia GeForce GTX 780 Ti |
1'279 |
50.8 |
122.86 % |
| Gigabyte G1 Gaming GeForce GTX 980 |
1'246 |
49.5 |
119.69 % |
| ASUS GeForce GTX 980 Poseidon Platinum |
1'244 |
49.4 |
119.50 % |
| MSI GTX 980 Gaming 4G |
1'230 |
48.8 |
118.16 % |
| ASUS Strix OC Edition GeForce GTX 980 |
1'217 |
48.3 |
116.91 % |
| nVIDIA GeForce
GTX 980 |
1'190 |
47.2 |
114.31 % |
| ASUS Radeon R9 290X Matrix Platinum |
1'102 |
45.3 |
105.86 % |
| AMD Radeon R9 290X |
1'079 |
42.5 |
103.65 % |
| ASUS Radeon R9 290 DirectCU II OC |
1'055 |
42.1 |
101.34 % |
| nVidia GeForce GTX TITAN |
1'051 |
41.7 |
100.96 % |
| nVidia GeForce GTX 780 |
1'041 |
41.3 |
100.00 % |
| AMD Radeon R9 290 |
997 |
39.8 |
95.77 % |
| nVidia GeForce GTX 970 |
924 |
36.7 |
88.76 % |
| AMD Radeon R9 280X |
765 |
30.4 |
73.49 % |
| ASUS Strix OC Edition GeForce GTX 960 |
583 |
28.5 |
56.00 % |
| Gigabyte G1 Gaming GeForce GTX 960 |
580 |
28.4 |
55.72 % |
| nVidia GeForce GTX 680 |
542 |
25.5 |
52.07 % |
|
PowerColor Radeon R9 285 TurboDuo |
533 |
25.2 |
51.20 % |
| |
More is better |
|
High Preset, 3840x2160 (2160p) |
Score |
Average FPS |
% |
| ASUS GeForce GTX 980 Matrix Platinum |
520 |
20.6 |
129.35 % |
| nVidia GeForce GTX 780 Ti |
516 |
20.5 |
128.36 % |
| ASUS Radeon R9 290X Matrix Platinum |
502 |
19.9 |
124.88 % |
| Gigabyte G1 Gaming GeForce GTX 980 |
499 |
19.8 |
124.13 % |
| MSI GTX 980 Gaming 4G |
495 |
19.7 |
123.13 % |
| ASUS GeForce GTX 980 Poseidon Platinum |
493 |
19.6 |
122.64 % |
| AMD Radeon R9 290X |
488 |
17.9 |
121.39 % |
| ASUS Strix OC Edition GeForce GTX 980 |
483 |
19.3 |
120.15 % |
| nVIDIA GeForce GTX 980 |
475 |
18.9 |
118.16 % |
| nVidia GeForce GTX TITAN |
437 |
17.4 |
108.71 % |
| ASUS Radeon
R9 290 DirectCU II OC |
406 |
16.1 |
101.00 % |
| nVidia GeForce GTX 780 |
402 |
17.0 |
100.00 % |
| AMD Radeon R9 290 |
383 |
15.2 |
95.27 % |
| nVidia GeForce GTX 970 |
370 |
14.7 |
92.04 % |
| ASUS Strix OC Edition GeForce GTX 960 |
224 |
10.1 |
55.72 % |
| Gigabyte G1 Gaming GeForce GTX 960 |
218 |
10.0 |
54.23 % |
| AMD Radeon R9 280X |
303 |
12.0 |
45.37 % |
|
PowerColor Radeon R9 285 TurboDuo |
117 |
8.8 |
29.10 % |
| nVidia GeForce GTX 680 |
42 |
1.7 |
10.45 % |
| |
More is better |
Unigine Heaven Settings |
|
1080p |
1440p |
2160p |
- Preset: Custom
- Quality: Ultra
- Tesselation: Extreme
- Stereo 3D: Disabled
- Multi Monitor: Disabled
- Anti Aliasing: 8x
- Full Screen: On
- Resolution: Custom
|
- Preset: Custom
- Quality: Ultra
- Tesselation: Extreme
- Stereo 3D: Disabled
- Multi Monitor: Disabled
- Anti Aliasing: 8x
- Full Screen: On
- Resolution: Custom
|
- Preset: Custom
- Quality: Ultra
- Tesselation: Extreme
- Stereo 3D: Disabled
- Multi Monitor: Disabled
- Anti Aliasing: 8x
- Full Screen: On
- Resolution: Custom
|
[pagebreak]
Bordlands - The Pre-Sequel
|
High Preset, 1920x1080 (1080p) |
Average FPS |
% |
| ASUS GeForce GTX 980 Matrix Platinum |
195.25 |
111.45 % |
| Gigabyte G1 Gaming GeForce GTX 980 |
195.01 |
111.29 % |
| ASUS GeForce GTX 980 Poseidon Platinum |
194.58 |
111.05 % |
| ASUS Radeon R9 290X Matrix Platinum |
193.47 |
110.42 % |
| MSI GTX 980 Gaming 4G |
192.45 |
109.83 % |
| AMD Radeon R9 290X |
191.26 |
109.15 % |
| ASUS Strix OC Edition GeForce GTX 980 |
191.22 |
109.13 % |
| ASUS
Radeon R9 290 DirectCU II OC |
188.52 |
107.59 % |
| nVidia GeForce GTX 780 Ti |
186.19 |
106.26 % |
| AMD Radeon R9 290 |
186.19 |
106.26 % |
| nVidia GeForce GTX 980 |
185.02 |
105.59 % |
| nVidia GeForce GTX TITAN |
178.54 |
101.89 % |
| nVidia GeForce GTX 970 |
177.18 |
101.12 % |
| nVidia GeForce GTX 780 |
175.22 |
100.00 % |
| AMD Radeon R9 280X |
158.87 |
90.67 % |
| nVidia GeForce GTX 680 |
157.21 |
89.72 % |
| PowerColor Radeon R9 285 TurboDuo |
146.83 |
83.80 % |
| ASUS Strix OC Edition GeForce GTX 960 |
137.54 |
78.50 % |
| Gigabyte G1 Gaming GeForce GTX 960 |
135.65 |
77.42 % |
|
More is better |
|
High Preset, 2560x1440 (1440p) |
Average FPS |
% |
| ASUS
GeForce GTX 980 Matrix Platinum |
152.57 |
126.96 % |
|
Gigabyte G1 Gaming GeForce GTX 980 |
151.24 |
125.88 % |
| ASUS
GeForce GTX 980 Poseidon Platinum |
150.94 |
125.63 % |
| MSI
GTX 980 Gaming 4G |
149.53 |
124.45 % |
| ASUS
Strix OC Edition GeForce GTX 980 |
146.31 |
121.77 % |
| nVidia
GeForce GTX 780 Ti |
143.91 |
119.78 % |
| ASUS
Radeon
R9 290X Matrix Platinum |
142.19 |
118.34 % |
| nVidia
GeForce GTX 980 |
141.38 |
117.67 % |
| AMD
Radeon R9 290X |
139.29 |
115.93 % |
| ASUS
Radeon
R9 290 DirectCU II OC |
135.62 |
112.88 % |
| AMD
Radeon R9 290 |
134.30 |
111.78 % |
| nVidia
GeForce GTX 970 |
123.76 |
103.00 % |
| nVidia
GeForce GTX TITAN |
125.33 |
104.31 % |
| nVidia
GeForce GTX 780 |
120.15 |
100.00 % |
| nVidia
GeForce GTX 680 |
108.97 |
90.69 % |
| AMD
Radeon R9 280X |
102.34 |
85.18 % |
|
PowerColor Radeon R9 285 TurboDuo |
99.84 |
83.10 % |
| ASUS
Strix OC Edition GeForce GTX 960 |
81.15 |
67.54 % |
|
Gigabyte G1 Gaming GeForce GTX 960 |
80.49 |
66.99 % |
|
More is better |
|
High Preset, 3840x2160 (2160p) |
Average FPS |
% |
| ASUS Radeon R9 290X Matrix Platinum |
72.96 |
112.16 % |
| ASUS GeForce GTX 980 Matrix Platinum |
70.88 |
108.96 % |
| Gigabyte G1 Gaming GeForce GTX 980 |
70.23 |
107.96 % |
| ASUS GeForce GTX 980 Poseidon Platinum |
70.12 |
107.79 % |
| MSI GTX 980 Gaming 4G |
69.98 |
107.58 % |
| ASUS Strix OC Edition GeForce GTX 980 |
69.87 |
107.41 % |
| AMD Radeon R9 290X |
69.20 |
106.38 % |
| nVidia GeForce GTX 780 Ti |
69.00 |
106.07 % |
| nVidia GeForce GTX TITAN |
68.44 |
105.21 % |
| nVidia GeForce GTX 980 |
67.85 |
104.30 % |
| nVidia GeForce GTX 970 |
67.42 |
103.64 % |
| ASUS Radeon R9 290 DirectCU II OC |
67.21 |
103.32 % |
| AMD Radeon R9 290 |
65.55 |
100.77 % |
| nVidia GeForce GTX 780 |
65.05 |
100.00 % |
| AMD Radeon R9 280X |
48.08 |
93.91 % |
| nVidia GeForce GTX 680 |
48.86 |
75.11 % |
| PowerColor Radeon R9 285 TurboDuo |
44.74 |
68.78 % |
| ASUS Strix OC Edition GeForce GTX 960 |
36.28 |
55.77 % |
| Gigabyte G1 Gaming GeForce GTX 960 |
35.59 |
54.71 % |
|
More is better |
Borderlands The Pre-Sequel Settings |
|
1080p |
1440p |
2160p |
- VSNYC: Off
- Framerate: Unlimited
- Anisotropic Filtering: 16x
- Bullet Decals: High
- Foliage Distance: Far
- Texture Quality: High
- Game Detail: High
- Ambient Occlusion: On
- Depth Of Field: On
- FXAA: on
- View Distance: Ultra High
- Physx Effects: Low
- Texture Fade: On
- Colorblind: Off
|
- VSNYC: Off
- Framerate: Unlimited
- Anisotropic Filtering: 16x
- Bullet Decals: High
- Foliage Distance: Far
- Texture Quality: High
- Game Detail: High
- Ambient Occlusion: On
- Depth Of Field: On
- FXAA: on
- View Distance: Ultra High
- Physx Effects: Low
- Texture Fade: On
- Colorblind: Off
|
- VSNYC: Off
- Framerate: Unlimited
- Anisotropic Filtering: 16x
- Bullet Decals: High
- Foliage Distance: Far
- Texture Quality: High
- Game Detail: High
- Ambient Occlusion: On
- Depth Of Field: On
- FXAA: on
- View Distance: Ultra High
- Physx Effects: Low
- Texture Fade: On
- Colorblind: Off
|
[pagebreak]
BattleField 4
|
High Preset, 1920x1080 (1080p) |
Average FPS |
% |
| ASUS GeForce GTX 980 Matrix Platinum |
92.31 |
141.13 % |
| Gigabyte G1 Gaming GeForce GTX 980 |
90.81 |
138.83 % |
| MSI GTX 980 Gaming 4G |
89.87 |
137.39 % |
| ASUS GeForce GTX 980 Poseidon Platinum |
89.64 |
137.04 % |
| ASUS Strix OC Edition GeForce GTX 980 |
88.74 |
135.67 % |
| nVidia GeForce GTX 980 |
86.86 |
132.79 % |
| nVidia GeForce GTX 780 Ti |
81.38 |
124.42 % |
| ASUS Radeon R9 290X Matrix Platinum |
73.40 |
112.22 % |
| AMD Radeon R9 290X |
71.74 |
109.68 % |
| nVidia GeForce GTX TITAN |
71.03 |
108.59 % |
| nVidia GeForce GTX 970 |
67.59 |
103.33 % |
| nVidia GeForce GTX 780 |
65.41 |
100.00 % |
| ASUS Radeon R9 290 DirectCU II OC |
62.98 |
96.28 % |
| AMD Radeon R9 290 |
60.23 |
92.08 % |
| ASUS Strix OC Edition GeForce GTX 960 |
50.30 |
76.90 % |
| AMD Radeon R9 280X |
52.74 |
80.63 % |
| PowerColor Radeon R9 285 TurboDuo |
49.53 |
75.75 % |
| nVidia GeForce GTX 680 |
48.55 |
74.22 % |
| Gigabyte G1 Gaming GeForce GTX 960 |
47.13 |
72.05 % |
|
More is better |
|
High Preset, 2560x1440 (1440p) |
Average FPS |
% |
| ASUS GeForce GTX 980 Matrix Platinum |
60.58 |
143.08 % |
| MSI GTX 980 Gaming 4G |
59.88 |
141.43 % |
| ASUS GeForce GTX 980 Poseidon Platinum |
58.97 |
139.28 % |
| Gigabyte G1 Gaming GeForce GTX 980 |
59.62 |
140.81 % |
| ASUS Strix OC Edition GeForce GTX 980 |
57.55 |
135.92 % |
| nVidia GeForce GTX 980 |
56.69 |
133.89 % |
| nVidia GeForce GTX 780 Ti |
53.85 |
127.18 % |
| ASUS Radeon
R9 290X Matrix Platinum |
48.22 |
113.89 % |
| AMD Radeon R9 290X |
47.12 |
111.29 % |
| nVidia GeForce GTX 970 |
46.80 |
110.53 % |
| nVidia GeForce GTX TITAN |
45.24 |
106.85 % |
| nVidia GeForce GTX 780 |
42.34 |
100.00 % |
| ASUS Radeon
R9 290 DirectCU II OC |
42.06 |
99.34 % |
| AMD Radeon R9 290 |
39.63 |
93.60 % |
| ASUS Strix OC Edition GeForce GTX 960 |
32.65 |
77.11 % |
| AMD Radeon R9 280X |
33.73 |
79.66 % |
| Gigabyte G1 Gaming GeForce GTX 960 |
30.65 |
72.39 % |
| PowerColor Radeon R9 285 TurboDuo |
28.59 |
67.52 % |
| nVidia GeForce GTX 680 |
27.22 |
64.29 % |
|
More is better |
|
High Preset, 3840x2160 (2160p) |
Average FPS |
% |
| ASUS GeForce GTX 980 Matrix Platinum |
34.05 |
162.37 % |
| Gigabyte G1 Gaming GeForce GTX 980 |
33.19 |
158.27 % |
| ASUS GeForce GTX 980 Poseidon Platinum |
32.96 |
157.18 % |
| MSI GTX 980 Gaming 4G |
32.68 |
155.84 % |
| ASUS Strix OC Edition GeForce GTX 980 |
31.88 |
152.03 % |
| nVidia GeForce GTX 980 |
30.44 |
145.16 % |
| nVidia GeForce GTX 780 Ti |
26.51 |
126.42 % |
| ASUS Radeon R9 290X Matrix Platinum |
25.05 |
119.46 % |
| nVidia GeForce GTX 970 |
25.03 |
119.36 % |
| AMD Radeon R9 290X |
24.75 |
118.03 % |
| ASUS Radeon R9 290 DirectCU II OC |
23.92 |
114.07 % |
| nVidia GeForce GTX TITAN |
23.86 |
113.78 % |
| AMD Radeon R9 290 |
23.81 |
113.54 % |
| nVidia GeForce GTX 780 |
20.97 |
100.00 % |
| AMD Radeon R9 280X |
16.90 |
80.59 % |
| ASUS Strix OC Edition GeForce GTX 960 |
14.00 |
66.76 % |
| PowerColor Radeon R9 285 TurboDuo |
13.85 |
66.05 % |
| Gigabyte G1 Gaming GeForce GTX 960 |
13.72 |
65.43 % |
| nVidia GeForce GTX 680 |
9.88 |
47.11 % |
|
More is better |
Battlefield 4 Settings |
|
1080p |
1440p |
2160p |
- Graphics Quality: Custom
- Texture Quality: Ultra
- Texture Filtering: Ultra
- Lighting Quality: Ultra
- FX Quality: Ultra
- Post Process Quality: Ultra
- Mesh Quality: Ultra
- Terrain Quality: Ultra
- Terrain Decoration: Ultra
- Antialiasing Deferred: 4x MSAA
- Antialiasing Post: High
- Ambient Occlusion: HBAO
|
[pagebreak]
Watch Dogs
| High Preset, 1920x1080 (1080p) |
Average FPS |
% |
| ASUS GeForce GTX 980 Matrix Platinum |
62.67 |
131.49 % |
| ASUS GeForce GTX 980 Poseidon Platinum |
60.22 |
126.35 % |
| MSI GTX 980 Gaming 4G |
60.12 |
126.14 % |
| Gigabyte G1 Gaming GeForce GTX 980 |
59.94 |
125.77 % |
| ASUS Strix OC Edition GeForce GTX 980 |
57.99 |
121.67 % |
| nVidia GeForce GTX 980 |
56.06 |
117.62 % |
| ASUS Radeon R9 290X Matrix Platinum |
52.08 |
109.27 % |
| AMD Radeon R9 290X |
51.72 |
108.27 % |
| ASUS Radeon R9 290 DirectCU II OC |
50.82 |
106.63 % |
| AMD Radeon R9 290 |
49.88 |
104.66 % |
| nVidia GeForce GTX 780 Ti |
49.44 |
103.73 % |
| nVidia GeForce GTX 970 |
48.28 |
101.30 % |
| nVidia GeForce GTX TITAN |
48.09 |
100.90 % |
| nVidia GeForce GTX 780 |
47.66 |
100.00 % |
| AMD Radeon R9 280X |
30.78 |
64.58 % |
| ASUS Strix OC Edition GeForce GTX 960 |
36.13 |
75.81 % |
| Gigabyte G1 Gaming GeForce GTX 960 |
35.12 |
73.69 % |
| PowerColor Radeon R9 285 TurboDuo |
28.39 |
59.57 % |
| nVidia GeForce GTX 680 |
23.54 |
49.39 % |
|
More is better |
|
High Preset, 2560x1440 (1440p) |
Average FPS |
|
| ASUS GeForce GTX 980 Matrix Platinum |
40.20 |
129.72 % |
| ASUS GeForce GTX 980 Poseidon Platinum |
38.57 |
124.46 % |
| Gigabyte G1 Gaming GeForce GTX 980 |
38.46 |
124.10 % |
| ASUS Strix OC Edition GeForce GTX 980 |
37.28 |
120.30 % |
| MSI GTX 980 Gaming 4G |
38.64 |
124.62 % |
| nVidia GeForce GTX 980 |
37.23 |
120.14 % |
| ASUS Radeon
R9 290X Matrix Platinum |
35.81 |
115.55 % |
| AMD Radeon R9 290X |
35.47 |
114.46 % |
| nVidia GeForce GTX 780 Ti |
34.34 |
110.81 % |
| nVidia GeForce GTX TITAN |
32.66 |
105.39 % |
| nVidia GeForce GTX 970 |
32.54 |
105.00 % |
| ASUS Radeon
R9 290 DirectCU II OC |
32.26 |
104.10 % |
| nVidia GeForce GTX 780 |
30.99 |
100.00 % |
| AMD Radeon R9 290 |
30.46 |
98.29 % |
| AMD Radeon R9 280X |
22.92 |
73.96 % |
| ASUS Strix OC Edition GeForce GTX 960 |
22.98 |
74.15 % |
| Gigabyte G1 Gaming GeForce GTX 960 |
22.10 |
71.31 % |
| PowerColor Radeon R9 285 TurboDuo |
21.22 |
68.47 % |
| nVidia GeForce GTX 680 |
19.21 |
61.99 % |
|
More is better |
|
High Preset, 3840x2160 (2160p) |
Average FPS |
|
| ASUS GeForce GTX 980 Matrix Platinum |
20.40 |
131.87 % |
| ASUS GeForce GTX 980 Poseidon Platinum |
20.29 |
131.16 % |
| Gigabyte G1 Gaming GeForce GTX 980 |
20.04 |
129.54 % |
| ASUS Radeon R9 290X Matrix Platinum |
20.00 |
129.28 % |
| MSI GTX 980 Gaming 4G |
20.20 |
130.58 % |
| AMD Radeon R9 290X |
19.67 |
127.15 % |
| ASUS Strix OC Edition GeForce GTX 980 |
18.99 |
122.75 % |
| nVidia GeForce GTX 980 |
18.75 |
121.20 % |
| nVidia GeForce GTX 780 Ti |
18.68 |
120.75 % |
| ASUS Radeon R9 290 DirectCU II OC |
17.03 |
110.08 % |
| AMD Radeon R9 290 |
16.46 |
106.40 % |
| nVidia GeForce GTX TITAN |
16.28 |
105.24 % |
| nVidia GeForce GTX 780 |
15.47 |
100.00 % |
| nVidia GeForce GTX 970 |
12.61 |
81.51 % |
| AMD Radeon R9 280X |
8.68 |
56.11 % |
| ASUS Strix OC Edition GeForce GTX 960 |
11.4 |
73.69 % |
| Gigabyte G1 Gaming GeForce GTX 960 |
10.9 |
70.85 % |
| PowerColor Radeon R9 285 TurboDuo |
8.8 |
56.88 % |
| nVidia GeForce GTX 680 |
6.80 |
43.96 % |
|
More is better |
Watch Dogs Settings |
|
1080p |
1440p |
2160p |
- Vsync: Off
- Color Blind Support: Off
- Graphics Quality: Custom
- Texture Quality: Ultra
- Shadow Quality: Ultra
- FX Quality: Ultra
- Mesh Quality: Ultra
- Terrain Quality: Ultra
- Terrain Decoration: Ultra
- Antialiasing Deferred: 4x MSAA
- Antialiasing Post: High
- Motion Blur: On
- Anisotropic Filter: 16x
- Ambient Occlusion: HBAO
|
[pagebreak]
Tomb Raider
|
High Preset, 1920x1080 (1080p) |
Average FPS |
% |
| ASUS GeForce GTX 980 Matrix Platinum |
56.00 |
145.83 % |
| Gigabyte G1 Gaming GeForce GTX 980 |
55.60 |
144.79 % |
| ASUS GeForce GTX 980 Poseidon Platinum |
55.20 |
143.75 % |
| MSI GTX 980 Gaming 4G |
54.60 |
142.19 % |
| ASUS Strix OC Edition GeForce GTX 980 |
53.70 |
139.84 % |
| nVidia GeForce GTX 980 |
52.20 |
135.94 % |
| nVidia GeForce GTX 780 Ti |
51.30 |
133.59 % |
| ASUS Radeon R9 290X Matrix Platinum |
48.60 |
126.56 % |
| AMD Radeon R9 290X |
48.40 |
126.04 % |
| ASUS Radeon R9 290 DirectCU II OC |
46.12 |
120.10 % |
| AMD Radeon R9 290 |
42.80 |
111.46 % |
| nVidia GeForce GTX 970 |
42.70 |
111.20 % |
| nVidia GeForce GTX TITAN |
40.90 |
106.51 % |
| nVidia GeForce GTX 780 |
38.40 |
100.00 % |
| AMD Radeon R9 280X |
34.10 |
88.80 % |
| ASUS Strix OC Edition GeForce GTX 960 |
31.80 |
82.81 % |
| Gigabyte G1 Gaming GeForce GTX 960 |
31.00 |
80.73 % |
| PowerColor Radeon R9 285 TurboDuo |
29.70 |
77.34 % |
| nVidia GeForce GTX 680 |
29.00 |
75.52 % |
|
More is better |
| High Preset, 2560x1440 (1440p) |
Average FPS |
% |
| ASUS GeForce GTX 980 Matrix Platinum |
35.20 |
162.21 % |
| Gigabyte G1 Gaming GeForce GTX 980 |
34.73 |
160.05 % |
| ASUS GeForce GTX 980 Poseidon Platinum |
34.10 |
157.14 % |
| MSI GTX 980 Gaming 4G |
34.00 |
156.68 % |
| ASUS Strix OC Edition GeForce GTX 980 |
33.28 |
153.36 % |
| nVidia GeForce GTX 780 Ti |
32.20 |
148.39 % |
| nVidia GeForce GTX 980 |
32.10 |
147.93 % |
| ASUS Radeon R9 290X Matrix Platinum |
30.60 |
141.01 % |
| AMD Radeon R9 290X |
30.30 |
139.63 % |
| ASUS Radeon R9 290 DirectCU II OC |
27.63 |
127.33 % |
| nVidia GeForce GTX 970 |
26.10 |
120.28 % |
| AMD Radeon R9 290 |
25.70 |
118.43 % |
| nVidia GeForce GTX TITAN |
24.70 |
113.82 % |
| nVidia GeForce GTX 780 |
21.70 |
100.00 % |
| AMD Radeon R9 280X |
21.20 |
97.70 % |
| ASUS Strix OC Edition GeForce GTX 960 |
19.40 |
89.40 % |
| Gigabyte G1 Gaming GeForce GTX 960 |
19.20 |
88.48 % |
| PowerColor Radeon R9 285 TurboDuo |
18.30 |
84.33 % |
| nVidia GeForce GTX 680 |
17.10 |
78.80 % |
|
More is better |
|
High Preset, 3840x2160 (2160p) |
Average FPS |
% |
| ASUS GeForce GTX 980 Matrix Platinum |
15.80 |
146.30 % |
| Gigabyte G1 Gaming GeForce GTX 980 |
15.70 |
145.37 % |
| ASUS GeForce GTX 980 Poseidon Platinum |
15.50 |
143.52 % |
| ASUS Strix OC Edition GeForce GTX 980 |
14.50 |
134.26 % |
| MSI GTX 980 Gaming 4G |
15.50 |
143.52 % |
| nVidia GeForce GTX 980 |
14.40 |
133.33 % |
| ASUS Radeon R9 290X Matrix Platinum |
14.20 |
131.48 % |
| AMD Radeon R9 290X |
14.10 |
130.56 % |
| nVidia GeForce GTX 780 Ti |
13.20 |
122.22 % |
| ASUS Radeon R9 290 DirectCU II OC |
12.43 |
115.09 % |
| AMD Radeon R9 290 |
11.70 |
108.33 % |
| nVidia GeForce GTX 970 |
11.10 |
102.78 % |
| nVidia GeForce GTX TITAN |
11.00 |
101.85 % |
| nVidia GeForce GTX 780 |
10.80 |
100.00 % |
| AMD Radeon R9 280X |
7.00 |
64.81 % |
| ASUS Strix OC Edition GeForce GTX 960 |
5.30 |
49.07 % |
| Gigabyte G1 Gaming GeForce GTX 960 |
5.00 |
46.30 % |
| PowerColor Radeon R9 285 TurboDuo |
5.00 |
46.30 % |
| nVidia GeForce GTX 680 |
3.00 |
27.78 % |
|
More is better |
Tomb Raider Settings |
|
1080p |
1440p |
2160p |
- Preset: Custom
- Texture Quality: Ultra
- Texture Filter: Anisotropic 16x
- Antialiasing: 4x SSAA
- Shadow: Ultra
- Shadow Resolution: High
- Level of Detail: Ultra
- Post Processing: On
- Tessellation: On
- High Precision: On
- Hair Quality: TressFX
- Reflections: High
- Depth of Field: Ultra
- SSAO: Ultra
|
[pagebreak]
Sniper Elite 3
|
High Preset, 1920x1080 (1080p) |
Average FPS |
% |
| ASUS GeForce GTX 980 Matrix Platinum |
58.02 |
150.31 % |
| ASUS GeForce GTX 980 Poseidon Platinum |
56.78 |
147.10 % |
| Gigabyte G1 Gaming GeForce GTX 980 |
56.52 |
146.42 % |
| ASUS Strix OC Edition GeForce GTX 980 |
54.63 |
141.53 % |
| MSI GTX 980 Gaming 4G |
57.00 |
147.67 % |
| nVidia GeForce GTX 980 |
54.22 |
140.47 % |
| ASUS Radeon R9 290X Matrix Platinum |
44.82 |
116.11 % |
| AMD Radeon R9 290X |
43.19 |
111.89 % |
| nVidia GeForce GTX 780 Ti |
42.35 |
109.72 % |
| nVidia GeForce GTX 970 |
39.94 |
103.47 % |
| ASUS Radeon R9 290 DirectCU II OC |
39.88 |
103.32 % |
| nVidia GeForce GTX TITAN |
39.87 |
103.29 % |
| nVidia GeForce GTX 780 |
38.60 |
100.00 % |
| AMD Radeon R9 290 |
37.32 |
96.68 % |
| AMD Radeon R9 280X |
32.06 |
83.06 % |
| ASUS Strix OC Edition GeForce GTX 960 |
30.10 |
77.98 % |
| PowerColor Radeon R9 285 TurboDuo |
29.20 |
75.65 % |
| Gigabyte G1 Gaming GeForce GTX 960 |
28.98 |
75.08 % |
| nVidia GeForce GTX 680 |
26.06 |
67.51 % |
|
More is better |
|
High Preset, 2560x1440 (1440p) |
Average FPS |
% |
| ASUS GeForce GTX 980 Matrix Platinum |
35.10 |
154.90 % |
| Gigabyte G1 Gaming GeForce GTX 980 |
33.80 |
149.16 % |
| ASUS GeForce GTX 980 Poseidon Platinum |
33.76 |
148.98 % |
| ASUS Strix OC Edition GeForce GTX 980 |
31.62 |
139.54 % |
| MSI GTX 980 Gaming 4G |
33.90 |
149.60 % |
| nVidia GeForce GTX 980 |
31.18 |
137.60 % |
| ASUS Radeon
R9 290X Matrix Platinum |
30.75 |
135.70 % |
| nVidia GeForce GTX 970 |
29.65 |
130.85 % |
| AMD Radeon R9 290X |
29.06 |
128.24 % |
| ASUS Radeon
R9 290 DirectCU II OC |
26.59 |
117.34 % |
| nVidia GeForce GTX 780 Ti |
24.42 |
107.77 % |
| AMD Radeon R9 290 |
24.17 |
106.66 % |
| nVidia GeForce GTX TITAN |
23.73 |
104.72 % |
| nVidia GeForce GTX 780 |
22.66 |
100.00 % |
| AMD Radeon R9 280X |
21.09 |
93.07 % |
| ASUS Strix OC Edition GeForce GTX 960 |
15.80 |
69.73 % |
| Gigabyte G1 Gaming GeForce GTX 960 |
15.30 |
67.52 % |
| PowerColor Radeon R9 285 TurboDuo |
15.30 |
62.52 % |
| nVidia GeForce GTX 680 |
13.20 |
58.25 % |
|
More is better |
|
High Preset, 3840x2160 (2160p) |
Average FPS |
% |
| ASUS GeForce GTX 980 Matrix Platinum |
19.07 |
203.30 % |
| ASUS GeForce GTX 980 Poseidon Platinum |
18.27 |
194.78 % |
| Gigabyte G1 Gaming GeForce GTX 980 |
18.22 |
194.24 % |
| MSI GTX 980 Gaming 4G |
18.24 |
194.46 % |
| ASUS Strix OC Edition GeForce GTX 980 |
16.87 |
179.85 % |
| nVidia GeForce GTX 980 |
16.08 |
171.43 % |
| ASUS Radeon
R9 290X Matrix Platinum |
16.03 |
170.90 % |
| AMD Radeon R9 290X |
15.75 |
167.91 % |
| ASUS Radeon
R9 290 DirectCU II OC |
14.52 |
154.80 % |
| AMD Radeon R9 290 |
13.75 |
146.59 % |
| nVidia GeForce GTX 780 Ti |
12.98 |
138.38 % |
| nVidia GeForce GTX TITAN |
10.22 |
108.96 % |
| nVidia GeForce GTX 970 |
9.43 |
100.53 % |
| nVidia GeForce GTX 780 |
9.38 |
100.00 % |
| AMD Radeon R9 280X |
8.75 |
93.28 % |
| ASUS Strix OC Edition GeForce GTX 960 |
8.10 |
86.35 % |
| Gigabyte G1 Gaming GeForce GTX 960 |
8.00 |
85.29 % |
| PowerColor Radeon R9 285 TurboDuo |
7.50 |
79.96 % |
| nVidia GeForce GTX 680 |
5.20 |
55.44 % |
|
More is better |
Sniper Elite 3 Settings |
|
1080p |
1440p |
2160p |
- Graphics Detail: Ultra
- AntiAliasing: High
- Texture Detail: Ultra
- Draw Distance: Ultra
- Anisotropic Filtering: 16
- Supersampling: 4.0x
- Motion Blur: Yes
- Ambient Occlusion: Yes
- V-Sync: No
- Use Tessellation: Yes
- Use Obscurance Fields: Yes
|
- Graphics Detail: Ultra
- AntiAliasing: High
- Texture Detail: Ultra
- Draw Distance: Ultra
- Anisotropic Filtering: 16
- Supersampling: 4.0x
- Motion Blur: Yes
- Ambient Occlusion: Yes
- V-Sync: No
- Use Tessellation: Yes
- Use Obscurance Fields: Yes
|
- Graphics Detail: Ultra
- AntiAliasing: High
- Texture Detail: Ultra
- Draw Distance: Ultra
- Anisotropic Filtering: 16
- Supersampling: 4.0x
- Motion Blur: Yes
- Ambient Occlusion: Yes
- V-Sync: No
- Use Tessellation: Yes
- Use Obscurance Fields: Yes
|
[pagebreak]
Crysis 3
|
High Preset, 1920x1080 (1080p) |
Average FPS |
% |
| ASUS GeForce GTX 980 Matrix Platinum |
39.47 |
123.23 % |
| nVidia GeForce GTX 780 Ti |
39.40 |
123.01 % |
| ASUS GeForce GTX 980 Poseidon Platinum |
38.99 |
121.73 % |
| Gigabyte G1 Gaming GeForce GTX 980 |
38.66 |
120.70 % |
| ASUS Strix OC Edition GeForce GTX 980 |
37.22 |
116.20 % |
| MSI GTX 980 Gaming 4G |
37.23 |
116.23 % |
| nVidia GeForce GTX 980 |
35.90 |
112.20 % |
| nVidia GeForce GTX TITAN |
32.06 |
100.09 % |
| nVidia GeForce GTX 780 |
32.03 |
100.00 % |
| nVidia GeForce GTX 970 |
29.59 |
92.38 % |
| ASUS Radeon
R9 290X Matrix Platinum |
28.33 |
88.45 % |
| AMD Radeon R9 290X |
27.86 |
86.98 % |
| ASUS Radeon
R9 290 DirectCU II OC |
26.07 |
81.39 % |
| AMD Radeon R9 290 |
24.73 |
77.21 % |
| AMD Radeon R9 280X |
18.65 |
58.23 % |
| nVidia GeForce GTX 680 |
23.56 |
73.56 % |
| PowerColor Radeon R9 285 TurboDuo |
23.30 |
72.74 % |
| ASUS Strix OC Edition GeForce GTX 960 |
21.98 |
68.62 % |
| Gigabyte G1 Gaming GeForce GTX 960 |
21.92 |
68.44 % |
|
More is better |
|
High Preset, 2560x1440 (1440p) |
Average FPS |
% |
| ASUS GeForce GTX 980 Matrix Platinum |
26.12 |
135.83 % |
| Gigabyte G1 Gaming GeForce GTX 980 |
25.98 |
135.10 % |
| ASUS GeForce GTX 980 Poseidon Platinum |
25.96 |
135.00 % |
| MSI GTX 980 Gaming 4G |
24.24 |
126.05 % |
| ASUS Strix OC Edition GeForce GTX 980 |
24.25 |
126.11 % |
| nVidia GeForce GTX 980 |
23.02 |
119.71 % |
| nVidia GeForce GTX 780 Ti |
22.57 |
117.37 % |
| nVidia GeForce GTX 970 |
20.14 |
104.73 % |
| nVidia GeForce GTX TITAN |
20.08 |
104.42 % |
| ASUS Radeon
R9 290X Matrix Platinum |
19.32 |
100.47 % |
| nVidia GeForce GTX 780 |
19.23 |
100.00 % |
| AMD Radeon R9 290X |
18.97 |
98.65 % |
| ASUS Radeon
R9 290 DirectCU II OC |
17.46 |
90.80 % |
| AMD Radeon R9 290 |
16.52 |
85.91 % |
| nVidia GeForce GTX 680 |
14.13 |
73.48 % |
| PowerColor Radeon R9 285 TurboDuo |
13.80 |
71.76 % |
| AMD Radeon R9 280X |
12.51 |
65.05 % |
| ASUS Strix OC Edition GeForce GTX 960 |
12.44 |
64.69 % |
| Gigabyte G1 Gaming GeForce GTX 960 |
12.44 |
64.69 % |
|
More is better |
| High Preset, 3840x2160 (2160p) |
Average FPS |
% |
| ASUS GeForce GTX 980 Matrix Platinum |
14.12 |
171.78 % |
| Gigabyte G1 Gaming GeForce GTX 980 |
13.53 |
164.60 % |
| ASUS GeForce GTX 980 Poseidon Platinum |
13.44 |
163.50 % |
| MSI GTX 980 Gaming 4G |
13.00 |
158.15 % |
| ASUS Strix OC Edition GeForce GTX 980 |
13.02 |
158.39 % |
| nVidia GeForce GTX 980 |
12.69 |
154.38 % |
| nVidia GeForce GTX 780 Ti |
9.80 |
119.22 % |
| nVidia GeForce GTX 970 |
9.68 |
117.76 % |
| nVidia GeForce GTX TITAN |
8.88 |
108.03 % |
| nVidia GeForce GTX 780 |
8.22 |
100.00 % |
| ASUS Radeon
R9 290X Matrix Platinum |
7.56 |
91.97 % |
| AMD Radeon R9 290X |
7.55 |
91.85 % |
| ASUS Radeon
R9 290 DirectCU II OC |
5.99 |
72.87 % |
| AMD Radeon R9 290 |
5.58 |
67.88 % |
| AMD Radeon R9 280X |
3.21 |
39.05 % |
| PowerColor Radeon R9 285 TurboDuo |
7.70 |
93.67 % |
| ASUS Strix OC Edition GeForce GTX 960 |
2.10 |
25.55 % |
| Gigabyte G1 Gaming GeForce GTX 960 |
2.10 |
25.55 % |
| nVidia GeForce GTX 680 |
1.50 |
18.25 % |
|
More is better |
Crysis 3 Settings |
|
1080p |
1440p |
2160p |
- Anti Aliasing: MSAA High 8x
- Texture Resolution: Very High
- Vsync: No
- System Spec: Very High
- Game Effects: Very High
- Object: Very High
- Particles: Very High
- Post Processing: Very High
- Shading: Very High
- Shadows: Very High
- Water: Very High
- Anisotropic Filtering: 16x
- Motion Blur Amount: High
- Lense Flares: Yes
|
[pagebreak]
Call of Duty: Advanced Warfare
|
High Preset, 1920x1080 (1080p) |
Average FPS |
% |
| ASUS GeForce GTX 980 Matrix Platinum |
85.21 |
147.22 % |
| Gigabyte G1 Gaming GeForce GTX 980 |
85.00 |
146.86 % |
| ASUS GeForce GTX 980 Poseidon Platinum |
84.33 |
145.70 % |
| MSI GTX 980 Gaming 4G |
83.87 |
144.90 % |
| ASUS Strix OC Edition GeForce GTX 980 |
82.17 |
141.97 % |
| nVidia GeForce GTX 980 |
80.99 |
139.93 % |
| nVidia GeForce GTX 780 Ti |
71.79 |
124.03 % |
| ASUS Radeon
R9 290X Matrix Platinum |
67.70 |
116.79 % |
| AMD Radeon R9 290X |
65.87 |
113.80 % |
| nVidia GeForce GTX 970 |
65.24 |
112.72 % |
| ASUS Radeon
R9 290 DirectCU II OC |
62.01 |
107.14 % |
| nVidia GeForce GTX TITAN |
61.26 |
105.84 % |
| AMD Radeon R9 290 |
60.57 |
104.65 % |
| nVidia GeForce GTX 780 |
57.88 |
100.00 % |
| AMD Radeon R9 280X |
55.94 |
96.65 % |
| ASUS Strix OC Edition GeForce GTX 960 |
46.03 |
79.53 % |
| Gigabyte G1 Gaming GeForce GTX 960 |
45.79 |
79.11 % |
| PowerColor Radeon R9 285 TurboDuo |
29.00 |
50.10 % |
| nVidia GeForce GTX 680 |
28.71 |
49.60 % |
|
More is better |
|
High Preset, 2560x1440 (1440p) |
Average FPS |
% |
| ASUS GeForce GTX 980 Matrix Platinum |
50.19 |
142.75 % |
| Gigabyte G1 Gaming GeForce GTX 980 |
50.11 |
142.52 % |
| ASUS GeForce GTX 980 Poseidon Platinum |
49.87 |
141.84 % |
| MSI GTX 980 Gaming 4G |
49.31 |
140.24 % |
| ASUS Strix OC Edition GeForce GTX 980 |
48.06 |
136.69 % |
| nVidia GeForce GTX 980 |
47.12 |
134.02 % |
| nVidia GeForce GTX 970 |
41.75 |
118.74 % |
| nVidia GeForce GTX 780 Ti |
40.74 |
115.87 % |
| ASUS Radeon
R9 290X Matrix Platinum |
40.28 |
114.56 % |
| AMD Radeon R9 290X |
38.97 |
110.84 % |
| nVidia GeForce GTX TITAN |
36.92 |
105.01 % |
| ASUS Radeon
R9 290 DirectCU II OC |
35.90 |
102.10 % |
| AMD Radeon R9 290 |
35.40 |
100.68 % |
| nVidia GeForce GTX 780 |
35.16 |
100.00 % |
| AMD Radeon R9 280X |
34.19 |
97.24 % |
| ASUS Strix OC Edition GeForce GTX 960 |
24.62 |
70.05 % |
| Gigabyte G1 Gaming GeForce GTX 960 |
23.99 |
68.23 % |
| PowerColor Radeon R9 285 TurboDuo |
21.24 |
60.41 % |
| nVidia GeForce GTX 680 |
20.21 |
57.48 % |
|
More is better |
|
High Preset, 3840x2160 (2160p) |
Average FPS |
% |
| ASUS GeForce GTX 980 Matrix Platinum |
24.56 |
204.33 % |
| Gigabyte G1 Gaming GeForce GTX 980 |
24.02 |
199.83 % |
| ASUS GeForce GTX 980 Poseidon Platinum |
23.54 |
195.84 % |
| MSI GTX 980 Gaming 4G |
22.14 |
184.19 % |
| ASUS Strix OC Edition GeForce GTX 980 |
21.00 |
174.71 % |
| nVidia GeForce GTX 980 |
20.07 |
166.97 % |
| nVidia GeForce GTX 970 |
18.32 |
152.41 % |
| ASUS Radeon
R9 290X Matrix Platinum |
17.88 |
148.75 % |
| AMD Radeon R9 290X |
17.65 |
146.84 % |
| nVidia GeForce GTX 780 Ti |
16.15 |
134.36 % |
| ASUS Radeon
R9 290 DirectCU II OC |
15.47 |
128.70 % |
| AMD Radeon R9 290 |
15.28 |
127.12 % |
| nVidia GeForce GTX TITAN |
17.58 |
146.26 % |
| nVidia GeForce GTX 780 |
12.02 |
100.00 % |
| AMD Radeon R9 280X |
11.22 |
127.50 % |
| PowerColor Radeon R9 285 TurboDuo |
3.88 |
44.09 % |
| ASUS Strix OC Edition GeForce GTX 960 |
2.00 |
22.73 % |
| Gigabyte G1 Gaming GeForce GTX 960 |
2.00 |
22.73 % |
| nVidia GeForce GTX 680 |
2.00 |
22.73 % |
|
More is better |
Call of Duty: Advanced Wirefare Settings |
|
1080p |
1440p |
2160p |
- Vsync: No
- Render Resolution: Native
- Texture Quality: manual
- Texture Resolution: Extra
- Normal Map Resolution: Extra
- Specular Map Resolution: Extra
- Anisotropic Filtering: High
- Shadows: On
- >Shadow Map Resolutiopn: High
- Cache Sun Shadow Maps: On
- Cache Spot Shadow Maps: On
- Depth of Field: High Quality
- Motion Blur: High Quality
- Screen Space Ambient Occlusion: Normal
-
Medium Distance Ambient Occlusion: On
- Sub Surface Scattering: On
- Depth PrepaSS: oN
- Post Process Anti-Aliasing: Filmic SMAA T2x
- Super Sampling: 4x
- Shader Preload: On
- Shader Preload During Cinematics: On
- Bullet Impacts: On
- Dynamic Light Limit: 8
|
[pagebreak]
Thief
|
High Preset, 1920x1080 (1080p) |
Average FPS |
% |
| ASUS GeForce GTX 980 Matrix Platinum |
84.5 |
133.28 % |
| Gigabyte G1 Gaming GeForce GTX 980 |
84.1 |
132.65 % |
| ASUS GeForce GTX 980 Poseidon Platinum |
83.3 |
131.39 % |
| MSI GTX 980 Gaming 4G |
84.8 |
133.75 % |
| ASUS Strix OC Edition GeForce GTX 980 |
82.5 |
130.13 % |
| nVidia GeForce GTX 980 |
80.5 |
126.97 % |
| nVidia GeForce GTX 780 Ti |
78.1 |
123.19 % |
| ASUS Radeon
R9 290X Matrix Platinum |
71.3 |
112.46 % |
| AMD Radeon R9 290X |
69.6 |
109.78 % |
| nVidia GeForce GTX 970 |
68.6 |
108.20 % |
| ASUS Radeon
R9 290 DirectCU II OC |
67.2 |
105.99 % |
| nVidia GeForce GTX TITAN |
65.1 |
102.68 % |
| AMD Radeon R9 290 |
64.4 |
101.58 % |
| nVidia GeForce GTX 780 |
63.4 |
100.00 % |
| PowerColor Radeon R9 285 TurboDuo |
53.3 |
84.07 % |
| AMD Radeon R9 280X |
50.6 |
79.81 % |
| ASUS Strix OC Edition GeForce GTX 960 |
49.7 |
78.39 % |
| Gigabyte G1 Gaming GeForce GTX 960 |
49.4 |
77.92 % |
| nVidia GeForce GTX 680 |
47.6 |
75.06 % |
|
More is better |
|
High Preset, 2560x1440 (1440p) |
Average FPS |
% |
| ASUS GeForce GTX 980 Matrix Platinum |
58.6 |
135.02 % |
| Gigabyte G1 Gaming GeForce GTX 980 |
58.3 |
134.33 % |
| ASUS GeForce GTX 980 Poseidon Platinum |
57.3 |
132.03 % |
| MSI GTX 980 Gaming 4G |
57.5 |
132.49 % |
| ASUS Strix OC Edition GeForce GTX 980 |
56.5 |
130.18 % |
| nVidia GeForce GTX 980 |
54.8 |
126.27 % |
| nVidia GeForce GTX 780 Ti |
54.3 |
125.12 % |
| ASUS Radeon
R9 290X Matrix Platinum |
49.6 |
114.29 % |
| AMD Radeon R9 290X |
48.9 |
112.67 % |
| ASUS Radeon
R9 290 DirectCU II OC |
46.8 |
107.83 % |
| nVidia GeForce GTX 970 |
46.1 |
106.22 % |
| nVidia GeForce GTX TITAN |
44.9 |
103.46 % |
| AMD Radeon R9 290 |
44.2 |
101.84 % |
| nVidia GeForce GTX 780 |
43.4 |
100.00 % |
| AMD Radeon R9 280X |
34.7 |
79.95 % |
| PowerColor Radeon R9 285 TurboDuo |
36.1 |
83.18 % |
| nVidia GeForce GTX 680 |
30.3 |
69.82 % |
| ASUS Strix OC Edition GeForce GTX 960 |
30.2 |
69.59 % |
| Gigabyte G1 Gaming GeForce GTX 960 |
30.1 |
69.35 % |
|
More is better |
|
High Preset, 3840x2160 (2160p) |
Average FPS |
% |
| ASUS GeForce GTX 980 Matrix Platinum |
31.6 |
145.62 % |
| Gigabyte G1 Gaming GeForce GTX 980 |
31.4 |
144.70 % |
| ASUS GeForce GTX 980 Poseidon Platinum |
30.3 |
139.63 % |
| ASUS Strix OC Edition GeForce GTX 980 |
30.1 |
138.71 % |
| MSI GTX 980 Gaming 4G |
30.5 |
140.55 % |
| nVidia GeForce GTX 980 |
29.4 |
135.48 % |
| nVidia GeForce GTX 780 Ti |
27.7 |
127.65 % |
| ASUS Radeon
R9 290X Matrix Platinum |
26.7 |
123.04 % |
| AMD Radeon R9 290X |
26.6 |
122.58 % |
| ASUS Radeon
R9 290 DirectCU II OC |
25.2 |
116.13 % |
| nVidia GeForce GTX 970 |
24.4 |
112.44 % |
| AMD Radeon R9 290 |
23.8 |
109.68 % |
| nVidia GeForce GTX TITAN |
23.5 |
108.29 % |
| nVidia GeForce GTX 780 |
21.7 |
100.00 % |
| AMD Radeon R9 280X |
17.0 |
78.34 % |
| PowerColor Radeon R9 285 TurboDuo |
14.5 |
66.82 % |
| ASUS Strix OC Edition GeForce GTX 960 |
7.9 |
36.41 % |
| Gigabyte G1 Gaming GeForce GTX 960 |
7.7 |
35.48 % |
| nVidia GeForce GTX 680 |
6.7 |
30.88 % |
|
More is better |
Thief Settings |
|
1080p |
1440p |
2160p |
- Vsync: Off
- Preset: Custom
- Texture Quality: Very High
- Shadow Quality: Very High
- Depth of Field Quality: High
- Texture Filtering Quality: 16x Anisotropic
- SSAA: High
- Automatically limit Texture Quality: On
- Screen Space Reflection: On
- Parallax Occlusion Mapping: On
- FXAA: On
- Contact Hardening Shadows: On
- Tesselation: On
- Image Based Reflection: On
|
[pagebreak]
GRID Autosport
|
High Preset, 1920x1080 (1080p) |
Average FPS |
% |
| ASUS GeForce GTX 980 Matrix Platinum |
132.08 |
153.51 % |
| Gigabyte G1 Gaming GeForce GTX 980 |
130.85 |
152.08 % |
| MSI GTX 980 Gaming 4G |
129.90 |
150.98 % |
| ASUS GeForce GTX 980 Poseidon Platinum |
128.65 |
149.52 % |
| ASUS Strix OC Edition GeForce GTX 980 |
127.03 |
147.65 % |
| nVidia GeForce GTX 980 |
118.88 |
138.17 % |
| nVidia GeForce GTX 970 |
111.41 |
129.49 % |
| nVidia GeForce GTX 780 Ti |
107.71 |
125.19 % |
| nVidia GeForce GTX TITAN |
87.86 |
102.12 % |
| nVidia GeForce GTX 780 |
86.04 |
100.00 % |
| ASUS Radeon
R9 290X Matrix Platinum |
77.85 |
90.48 % |
| AMD Radeon R9 290X |
76.70 |
89.14 % |
| ASUS Radeon
R9 290 DirectCU II OC |
74.31 |
86.37 % |
| AMD Radeon R9 290 |
73.95 |
85.95 % |
| ASUS Strix OC Edition GeForce GTX 960 |
74.48 |
86.56 % |
| Gigabyte G1 Gaming GeForce GTX 960 |
73.14 |
85.01 % |
| nVidia GeForce GTX 680 |
70.65 |
82.11 % |
| AMD Radeon R9 280X |
69.17 |
80.39 % |
| PowerColor Radeon R9 285 TurboDuo |
68.55 |
79.67 % |
|
More is better |
|
High Preset, 2560x1440 (1440p) |
Average FPS |
% |
| ASUS GeForce GTX 980 Matrix Platinum |
107.22 |
165.74 % |
| Gigabyte G1 Gaming GeForce GTX 980 |
106.48 |
164.60 % |
| ASUS GeForce GTX 980 Poseidon Platinum |
105.33 |
162.82 % |
| ASUS Strix OC Edition GeForce GTX 980 |
104.89 |
162.14 % |
| MSI GTX 980 Gaming 4G |
105.13 |
162.51 % |
| nVidia GeForce GTX 980 |
100.31 |
155.06 % |
| nVidia GeForce GTX 970 |
86.70 |
134.02 % |
| nVidia GeForce GTX 780 Ti |
84.10 |
130.00 % |
| ASUS Radeon
R9 290X Matrix Platinum |
75.10 |
116.09 % |
| AMD Radeon R9 290X |
74.70 |
115.47 % |
| ASUS Radeon
R9 290 DirectCU II OC |
71.72 |
110.87 % |
| AMD Radeon R9 290 |
70.08 |
108.33 % |
| nVidia GeForce GTX TITAN |
67.39 |
104.17 % |
| nVidia GeForce GTX 780 |
64.69 |
100.00 % |
| AMD Radeon R9 280X |
61.35 |
94.84 % |
| Gigabyte G1 Gaming GeForce GTX 960 |
53.34 |
82.45 % |
| ASUS Strix OC Edition GeForce GTX 960 |
47.80 |
73.89 % |
| nVidia GeForce GTX 680 |
47.43 |
73.32 % |
| PowerColor Radeon R9 285 TurboDuo |
46.16 |
71.36 % |
|
More is better |
|
High Preset, 3840x2160 (2160p) |
Average FPS |
% |
| ASUS GeForce GTX 980 Matrix Platinum |
61.97 |
168.08 % |
| ASUS GeForce GTX 980 Poseidon Platinum |
61.89 |
167.86 % |
| Gigabyte G1 Gaming GeForce GTX 980 |
61.51 |
166.83 % |
| MSI GTX 980 Gaming 4G |
60.76 |
164.80 % |
| ASUS Strix OC Edition GeForce GTX 980 |
59.39 |
161.08 % |
| nVidia GeForce GTX 980 |
59.62 |
161.70 % |
| nVidia GeForce GTX 780 Ti |
49.37 |
133.90 % |
| ASUS Radeon
R9 290X Matrix Platinum |
49.12 |
133.22 % |
| nVidia GeForce GTX 970 |
48.60 |
131.81 % |
| AMD Radeon R9 290X |
48.55 |
131.68 % |
| ASUS Radeon
R9 290 DirectCU II OC |
47.14 |
127.85 % |
| AMD Radeon R9 290 |
44.52 |
120.75 % |
| nVidia GeForce GTX TITAN |
38.48 |
104.37 % |
| nVidia GeForce GTX 780 |
36.87 |
100.00 % |
| AMD Radeon R9 280X |
36.06 |
97.80 % |
| ASUS Strix OC Edition GeForce GTX 960 |
31.41 |
85.35 % |
| Gigabyte G1 Gaming GeForce GTX 960 |
30.86 |
83.70 % |
| nVidia GeForce GTX 680 |
28.17 |
70.98 % |
| PowerColor Radeon R9 285 TurboDuo |
26.21 |
71.09 % |
|
More is better |
GRID Autosport Settings |
|
1080p |
1440p |
2160p |
- Full Screen: On
- Vsync: Off
- Nigh Lightning: Ultra
- Advanced Fog: On
- Particles: Ultra
- Cloths: Ultra
- Ambient Occlusion: Ultra
- Soft Ambient Occlusion: On
- Ground Cover: Ultra
- Vehicle Details: Ultra
- Vehicle Reflections: Ultra
- Objects: Ultra
- Trees: Ultra
- Crowds: Ultra
- Water: High
- Advanced Lighting: Enabled
- Global Illumination: On
- Texture Quality: High
- Shader Quality: High
- Anisotropic Filtering: Ultra
- Smoke: Shadows: on
|
[pagebreak]
Sleeping Dogs - Benchmark
|
High Preset, 1920x1080 (1080p) |
Average FPS |
% |
| ASUS GeForce GTX 980 Matrix Platinum |
87.0 |
133.64 % |
| Gigabyte G1 Gaming GeForce GTX 980 |
86.6 |
133.03 % |
| ASUS GeForce GTX 980 Poseidon Platinum |
85.7 |
131.64 % |
| ASUS Strix OC Edition GeForce GTX 980 |
84.1 |
129.19 % |
| MSI GTX 980 Gaming 4G |
85.4 |
131.18 % |
| nVidia GeForce GTX 780 Ti |
82.6 |
126.88 % |
| nVidia GeForce GTX 980 |
82.4 |
126.57 % |
| ASUS Radeon
R9 290X Matrix Platinum |
78.9 |
121.20 % |
| AMD Radeon R9 290X |
78.2 |
120.12 % |
| nVidia GeForce GTX 970 |
68.9 |
105.84 % |
| ASUS Radeon
R9 290 DirectCU II OC |
67.7 |
103.99 % |
| nVidia GeForce GTX TITAN |
67.0 |
102.92 % |
| nVidia GeForce GTX 780 |
65.1 |
100.00 % |
| AMD Radeon R9 290 |
63.5 |
97.54 % |
| AMD Radeon R9 280X |
51.4 |
78.96 % |
| ASUS Strix OC Edition GeForce GTX 960 |
46.7 |
71.74 % |
| Gigabyte G1 Gaming GeForce GTX 960 |
46.6 |
71.58 % |
| nVidia GeForce GTX 680 |
46.4 |
71.27 % |
| PowerColor Radeon R9 285 TurboDuo |
45.5 |
69.89 % |
|
More is better |
|
High Preset, 2560x1440 (1440p) |
Average FPS |
% |
| ASUS GeForce GTX 980 Matrix Platinum |
51.6 |
136.15 % |
| Gigabyte G1 Gaming GeForce GTX 980 |
51.2 |
135.09 % |
| ASUS GeForce GTX 980 Poseidon Platinum |
50.6 |
133.51 % |
| ASUS Strix OC Edition GeForce GTX 980 |
50.1 |
132.19 % |
| MSI GTX 980 Gaming 4G |
50.7 |
133.77 % |
| nVidia GeForce GTX 780 Ti |
49.4 |
130.34 % |
| nVidia GeForce GTX 980 |
49.0 |
129.29 % |
| ASUS Radeon
R9 290X Matrix Platinum |
45.8 |
120.84 % |
| AMD Radeon R9 290X |
45.0 |
118.73 % |
| ASUS Radeon
R9 290 DirectCU II OC |
40.3 |
106.33 % |
| nVidia GeForce GTX 970 |
39.5 |
104.22 % |
| nVidia GeForce GTX TITAN |
38.9 |
102.64 % |
| nVidia GeForce GTX 780 |
37.9 |
100.00 % |
| AMD Radeon R9 290 |
37.8 |
99.74 % |
| AMD Radeon R9 280X |
31.2 |
82.32 % |
| nVidia GeForce GTX 680 |
28.0 |
73.88 % |
| PowerColor Radeon R9 285 TurboDuo |
27.9 |
73.61 % |
| ASUS Strix OC Edition GeForce GTX 960 |
24.9 |
65.70 % |
| Gigabyte G1 Gaming GeForce GTX 960 |
24.7 |
65.17 % |
|
More is better |
|
High Preset, 3840x2160 (2160p) |
Average FPS |
% |
| ASUS GeForce GTX 980 Matrix Platinum |
21.2 |
148.25 % |
| Gigabyte G1 Gaming GeForce GTX 980 |
21.2 |
148.25 % |
| ASUS GeForce GTX 980 Poseidon Platinum |
20.8 |
145.45 % |
| ASUS Strix OC Edition GeForce GTX 980 |
20.5 |
143.36 % |
| MSI GTX 980 Gaming 4G |
20.9 |
143.15 % |
| nVidia GeForce GTX 980 |
19.5 |
136.36 % |
| nVidia GeForce GTX 780 Ti |
18.8 |
131.47 % |
| ASUS Radeon
R9 290X Matrix Platinum |
17.0 |
118.88 % |
| AMD Radeon R9 290X |
16.9 |
118.18 % |
| ASUS Radeon
R9 290 DirectCU II OC |
16.2 |
113.29 % |
| AMD Radeon R9 290 |
15.8 |
110.49 % |
| nVidia GeForce GTX 970 |
15.4 |
107.69 % |
| nVidia GeForce GTX TITAN |
15.1 |
105.59 % |
| nVidia GeForce GTX 780 |
14.3 |
100.00 % |
| AMD Radeon R9 280X |
10.8 |
75.52 % |
| nVidia GeForce GTX 680 |
5.1 |
35.66 % |
| PowerColor Radeon R9 285 TurboDuo |
5.0 |
34.97 % |
| Gigabyte G1 Gaming GeForce GTX 960 |
4.9 |
34.27 % |
| ASUS Strix OC Edition GeForce GTX 960 |
4.9 |
34.27 % |
|
More is better |
Sleeping Dogs Settings |
|
1080p |
1440p |
2160p |
- Full Screen: On
- Graphics Level: Extreme
- Enable Quality Anti Aliasing: Extreme
- Enable High Res Textures: On
- Shadow Resolution: High
- Shadow Filtering: High
- Screen Space Ambient Occlusion: High
- Enable Vsync: Off
- Enable Quality Motion Blur: High
- World Density: Extreme
|
- Full Screen: On
- Graphics Level: Extreme
- Enable Quality Anti Aliasing: Extreme
- Enable High Res Textures: On
- Shadow Resolution: High
- Shadow Filtering: High
- Screen Space Ambient Occlusion: High
- Enable Vsync: Off
- Enable Quality Motion Blur: High
- World Density: Extreme
|
- Full Screen: On
- Graphics Level: Extreme
- Enable Quality Anti Aliasing: Extreme
- Enable High Res Textures: On
- Shadow Resolution: High
- Shadow Filtering: High
- Screen Space Ambient Occlusion: High
- Enable Vsync: Off
- Enable Quality Motion Blur: High
- World Density: Extreme
|
[pagebreak]
Metro: Last Light - Benchmark
|
High Preset, 1920x1080 (1080p) |
Average FPS |
% |
| ASUS GeForce GTX 980 Matrix Platinum |
57.43 |
128.82 % |
| Gigabyte G1 Gaming GeForce GTX 980 |
56.98 |
127.82 % |
| ASUS GeForce GTX 980 Poseidon Platinum |
56.92 |
127.68 % |
| ASUS Strix OC Edition GeForce GTX 980 |
56.73 |
127.25 % |
| MSI GTX 980 Gaming 4G |
56.60 |
126.96 % |
| nVidia GeForce GTX 780 Ti |
56.54 |
126.83 % |
| nVidia GeForce GTX 980 |
52.53 |
117.83 % |
| ASUS Radeon
R9 290X Matrix Platinum |
49.26 |
110.50 % |
| AMD Radeon R9 290X |
49.06 |
110.05 % |
| ASUS Radeon
R9 290 DirectCU II OC |
45.42 |
101.88 % |
| nVidia GeForce GTX TITAN |
44.63 |
100.11 % |
| nVidia GeForce GTX 780 |
44.58 |
100.00 % |
| nVidia GeForce GTX 970 |
43.85 |
98.36 % |
| AMD Radeon R9 290 |
42.89 |
96.21 % |
| AMD Radeon R9 280X |
34.50 |
77.39 % |
| ASUS Strix OC Edition GeForce GTX 960 |
33.92 |
76.09 % |
| PowerColor Radeon R9 285 TurboDuo |
33.49 |
75.12 % |
| Gigabyte G1 Gaming GeForce GTX 960 |
33.32 |
74.74 % |
| nVidia GeForce GTX 680 |
32.80 |
73.58 % |
|
More is better |
|
High Preset, 2560x1440 (1440p) |
Average FPS |
% |
| ASUS GeForce GTX 980 Matrix Platinum |
41.22 |
131.95 % |
| Gigabyte G1 Gaming GeForce GTX 980 |
40.14 |
128.49 % |
| ASUS GeForce GTX 980 Poseidon Platinum |
40.08 |
128.30 % |
| ASUS Strix OC Edition GeForce GTX 980 |
39.87 |
127.62 % |
| MSI GTX 980 Gaming 4G |
39.77 |
127.30 % |
| nVidia GeForce GTX 780 Ti |
39.76 |
127.27 % |
| nVidia GeForce GTX 980 |
36.22 |
115.94 % |
| ASUS Radeon
R9 290X Matrix Platinum |
35.46 |
113.51 % |
| AMD Radeon R9 290X |
34.57 |
110.66 % |
| ASUS Radeon
R9 290 DirectCU II OC |
32.95 |
105.47 % |
| nVidia GeForce GTX TITAN |
31.70 |
101.47 % |
| nVidia GeForce GTX 780 |
31.24 |
100.00 % |
| nVidia GeForce GTX 970 |
30.89 |
98.88 % |
| AMD Radeon R9 290 |
30.50 |
97.63 % |
| AMD Radeon R9 280X |
25.12 |
80.41 % |
| ASUS Strix OC Edition GeForce GTX 960 |
20.60 |
65.94 % |
| Gigabyte G1 Gaming GeForce GTX 960 |
20.40 |
65.30 % |
| PowerColor Radeon R9 285 TurboDuo |
19.98 |
63.96 % |
| nVidia GeForce GTX 680 |
19.23 |
61.56 % |
|
More is better |
|
High Preset, 3840x2160 (2160p) |
Average FPS |
% |
| ASUS GeForce GTX 980 Matrix Platinum |
19.0 |
127.52 % |
| Gigabyte G1 Gaming GeForce GTX 980 |
18.30 |
122.82 % |
| ASUS GeForce GTX 980 Poseidon Platinum |
18.25 |
122.48 % |
| ASUS Strix OC Edition GeForce GTX 980 |
17.98 |
120.67 % |
| MSI GTX 980 Gaming 4G |
17.80 |
119.46 % |
| nVidia GeForce GTX 780 Ti |
17.72 |
118.93 % |
| nVidia GeForce GTX 980 |
17.05 |
114.43 % |
| ASUS Radeon
R9 290X Matrix Platinum |
15.67 |
105.17 % |
| AMD Radeon R9 290X |
15.60 |
104.70 % |
| nVidia GeForce GTX TITAN |
15.10 |
101.34 % |
| nVidia GeForce GTX 780 |
14.90 |
100.00 % |
| ASUS Radeon
R9 290 DirectCU II OC |
14.73 |
98.86 % |
| nVidia GeForce GTX 970 |
14.52 |
97.45 % |
| AMD Radeon R9 290 |
13.91 |
93.36 % |
| AMD Radeon R9 280X |
11.73 |
78.72 % |
| PowerColor Radeon R9 285 TurboDuo |
9.99 |
67.05 % |
| ASUS Strix OC Edition GeForce GTX 960 |
9.86 |
66.17 % |
| Gigabyte G1 Gaming GeForce GTX 960 |
9.54 |
64.03 % |
| nVidia GeForce GTX 680 |
8.68 |
58.26 % |
|
More is better |
Metro: Last Light Settings |
| 1080p |
1440p |
2160p |
- Quality: Very High
- Texture Filtering: AF16x
- Motion Blur: Normal
- SSAA: On
- Tesselation: Very High
- Scene: D6
- Runs: 3
|
- Quality: Very High
- Texture Filtering: AF16x
- Motion Blur: Normal
- SSAA: On
- Tesselation: Very High
- Scene: D6
- Runs: 3
|
- Quality: Very High
- Texture Filtering: AF16x
- Motion Blur: Normal
- SSAA: On
- Tesselation: Very High
- Scene: D6
- Runs: 3
|
[pagebreak]
Assassin’s Creed Unity
|
High Preset, 1920x1080 (1080p) |
Average FPS |
% |
| ASUS GeForce GTX 980 Matrix Platinum |
50.29 |
131.93 % |
| Gigabyte G1 Gaming GeForce GTX 980 |
49.02 |
128.59 % |
| ASUS GeForce GTX 980 Poseidon Platinum |
48.64 |
127.60 % |
| ASUS Strix OC Edition GeForce GTX 980 |
47.99 |
125.89 % |
| MSI GTX 980 Gaming 4G |
47.24 |
123.92 % |
| nVidia GeForce GTX 980 |
45.22 |
118.63 % |
| nVidia GeForce GTX 780 Ti |
40.67 |
106.69 % |
| nVidia GeForce GTX 970 |
39.54 |
103.73 % |
| nVidia GeForce GTX TITAN |
39.22 |
102.89 % |
| ASUS Radeon
R9 290X Matrix Platinum |
38.84 |
101.89 % |
| AMD Radeon R9 290X |
38.18 |
100.16 % |
| nVidia GeForce GTX 780 |
38.12 |
100.00 % |
| ASUS Radeon
R9 290 DirectCU II OC |
36.96 |
96.96 % |
| AMD Radeon R9 290 |
36.41 |
95.51 % |
| AMD Radeon R9 280X |
27.38 |
71.83 % |
| ASUS Strix OC Edition GeForce GTX 960 |
23.87 |
62.62 % |
| Gigabyte G1 Gaming GeForce GTX 960 |
23.54 |
61.75 % |
| PowerColor Radeon R9 285 TurboDuo |
22.39 |
58.74 % |
| nVidia GeForce GTX 680 |
21.36 |
56.03 % |
|
More is better |
|
High Preset, 2560x1440 (1440p) |
Average FPS |
% |
| ASUS
GeForce GTX 980 Matrix Platinum |
30.83 |
156.74 % |
|
Gigabyte G1 Gaming GeForce GTX 980 |
28.87 |
146.77 % |
| ASUS
GeForce GTX 980 Poseidon Platinum |
28.13 |
143.01 % |
| MSI
GTX 980 Gaming 4G |
27.72 |
140.93 % |
| ASUS
Strix OC Edition GeForce GTX 980 |
27.64 |
140.59 % |
| nVidia
GeForce GTX 980 |
27.14 |
137.98 % |
| nVidia
GeForce GTX 780 Ti |
26.81 |
136.30 % |
| ASUS
Radeon
R9 290X Matrix Platinum |
26.52 |
134.82 % |
| nVidia
GeForce GTX TITAN |
26.41 |
134.27 % |
| AMD
Radeon R9 290X |
25.97 |
132.03 % |
| nVidia
GeForce GTX 970 |
23.31 |
118.51 % |
| ASUS
Radeon
R9 290 DirectCU II OC |
23.08 |
117.34 % |
| AMD
Radeon R9 290 |
22.75 |
115.66 % |
| nVidia
GeForce GTX 780 |
19.67 |
100.00 % |
| AMD
Radeon R9 280X |
18.30 |
93.04 % |
|
PowerColor Radeon R9 285 TurboDuo |
12.68 |
64.46 % |
| ASUS
Strix OC Edition GeForce GTX 960 |
11.88 |
60.40 % |
| Gigabyte G1 Gaming GeForce GTX 960 |
11.53 |
58.62 % |
| nVidia
GeForce GTX 680 |
11.22 |
57.04 % |
|
More is better |
|
High Preset, 3840x2160 (2160p) |
Average FPS |
% |
| ASUS GeForce GTX 980 Matrix Platinum |
15.70 |
145.37 % |
| Gigabyte G1 Gaming GeForce GTX 980 |
15.00 |
138.89 % |
| nVidia GeForce GTX TITAN |
14.46 |
133.89 % |
| ASUS GeForce GTX 980 Poseidon Platinum |
14.27 |
132.13 % |
| ASUS Strix OC Edition GeForce GTX 980 |
14.24 |
131.85 % |
| MSI GTX 980 Gaming 4G |
14.06 |
130.19 % |
| nVidia GeForce GTX 980 |
13.34 |
123.52 % |
| nVidia GeForce GTX 780 Ti |
12.54 |
116.11 % |
| nVidia GeForce GTX 970 |
11.73 |
108.61 % |
| ASUS Radeon
R9 290X Matrix Platinum |
10.86 |
100.56 % |
| nVidia GeForce GTX 780 |
10.80 |
100.00 % |
| AMD Radeon R9 290X |
10.40 |
96.30 % |
| ASUS Radeon
R9 290 DirectCU II OC |
10.20 |
94.44 % |
| AMD Radeon R9 290 |
10.12 |
93.70 % |
| AMD Radeon R9 280X |
7.84 |
72.59 % |
| ASUS Strix OC Edition GeForce GTX 960 |
5.20 |
48.15 % |
| Gigabyte G1 Gaming GeForce GTX 960 |
5.10 |
47.22 % |
| PowerColor Radeon R9 285 TurboDuo |
5.10 |
47.22 % |
| nVidia GeForce GTX 680 |
4.00 |
37.04 % |
|
More is better |
Assassin’s Creed Unity Settings |
| 1080p |
1440p |
2160p |
- Blood Fx : On
- Companion app : On
- Graphics Quality: Ultra High
- VSync: Of
- Streching: on
- Envirnoment Quality: Ultra High
- Texture Quality: Ultra High
- Shadow Quality : PCSS
- Ambient Occlusion: HBAO+
- Anti-Aliasing Quality: MSAA-4X
- Bloom: On
|
- Blood Fx : On
- Companion app : On
- Graphics Quality: Ultra High
- VSync: Of
- Streching: on
- Envirnoment Quality: Ultra High
- Texture Quality: Ultra High
- Shadow Quality : PCSS
- Ambient Occlusion: HBAO+
- Anti-Aliasing Quality: MSAA-4X
- Bloom: On
|
- Blood Fx : On
- Companion app : On
- Graphics Quality: Ultra High
- VSync: Of
- Streching: on
- Envirnoment Quality: Ultra High
- Texture Quality: Ultra High
- Shadow Quality : PCSS
- Ambient Occlusion: HBAO+
- Anti-Aliasing Quality: MSAA-4X
- Bloom: On
|
[pagebreak]
Far Cry 4
|
High Preset, 1920x1080 (1080p) |
Average FPS |
% |
| ASUS GeForce GTX 980 Matrix Platinum |
57.22 |
165.71 % |
| ASUS GeForce GTX 980 Poseidon Platinum |
56.97 |
164.99 % |
| Gigabyte G1 Gaming GeForce GTX 980 |
56.83 |
164.58 % |
| MSI GTX 980 Gaming 4G |
55.80 |
161.60 % |
| ASUS Strix OC Edition GeForce GTX 980 |
55.62 |
161.08 % |
| nVidia GeForce GTX 980 |
53.97 |
156.30 % |
| nVidia GeForce GTX 780 Ti |
52.17 |
151.09 % |
| nVidia GeForce GTX 970 |
49.69 |
143.90 % |
| nVidia GeForce GTX TITAN |
47.42 |
137.33 % |
| ASUS Radeon R9 290X Matrix Platinum |
46.80 |
135.53 % |
| AMD Radeon R9 290X |
44.87 |
129.94 % |
| AMD Radeon R9 290 |
40.82 |
118.22 % |
| ASUS Radeon R9 290 DirectCU II OC |
40.50 |
117.29 % |
| nVidia GeForce GTX 780 |
34.53 |
100.00 % |
| ASUS Strix OC Edition GeForce GTX 960 |
33.33 |
96.52 % |
| Gigabyte G1 Gaming GeForce GTX 960 |
33.30 |
96.44 % |
| AMD Radeon R9 280X |
29.50 |
85.43 % |
| PowerColor Radeon R9 285 TurboDuo |
26.67 |
77.24 % |
| nVidia GeForce GTX 680 |
25.11 |
72.72 % |
|
More is better |
|
High Preset, 2560x1440 (1440p) |
Average FPS |
% |
| ASUS
GeForce GTX 980 Matrix Platinum |
38.14 |
164.40 % |
| .40
ASUS GeForce GTX 980 Poseidon Platinum |
37.77 |
162.80 % |
| Gigabyte
G1 Gaming GeForce GTX 980 |
37.68 |
162.41 % |
| MSI GTX
980 Gaming 4G |
37.10 |
159.91 % |
| ASUS
Strix OC Edition GeForce GTX 980 |
36.60 |
157.76 % |
| nVidia
GeForce GTX 980 |
34.88 |
150.94 % |
| nVidia
GeForce GTX 780 Ti |
32.69 |
140.91 % |
| ASUS
Radeon R9 290X Matrix Platinum |
32.56 |
140.34 % |
| AMD
Radeon R9 290X |
31.22 |
134.57 % |
| nVidia
GeForce GTX 970 |
30.93 |
133.32 % |
| nVidia
GeForce GTX TITAN |
30.37 |
130.91 % |
| AMD
Radeon R9 290 |
28.80 |
124.14 % |
| ASUS
Radeon R9 290 DirectCU II OC |
27.97 |
120.56 % |
| nVidia
GeForce GTX 780 |
23.20 |
100.00 % |
| AMD
Radeon R9 280X |
21.77 |
93.84 % |
| ASUS
Strix OC Edition GeForce GTX 960 |
19.22 |
82.84 % |
|
Gigabyte G1 Gaming GeForce GTX 960 |
19.08 |
82.24 % |
|
PowerColor Radeon R9 285 TurboDuo |
18.54 |
79.91 % |
| nVidia
GeForce GTX 680 |
16.76 |
72.24 % |
|
More is better |
|
High Preset, 3840x2160 (2160p) |
Average FPS |
% |
| ASUS GeForce GTX 980 Matrix Platinum |
17.68 |
200.91 % |
| ASUS GeForce GTX 980 Poseidon Platinum |
17.16 |
195.00 % |
| Gigabyte G1 Gaming GeForce GTX 980 |
17.09 |
194.20 % |
| MSI GTX 980 Gaming 4G |
17.01 |
193.30 % |
| ASUS Strix OC Edition GeForce GTX 980 |
16.98 |
192.95 % |
| nVidia GeForce GTX 980 |
16.00 |
181.82 % |
| nVidia GeForce GTX TITAN |
15.76 |
179.09 % |
| nVidia GeForce GTX 780 Ti |
14.00 |
159.09 % |
| nVidia GeForce GTX 970 |
12.67 |
143.98 % |
| ASUS Radeon
R9 290X Matrix Platinum |
10.11 |
114.89 % |
| AMD Radeon R9 290X |
9.74 |
110.68 % |
| ASUS Radeon R9 290 DirectCU II OC |
9.01 |
102.39 % |
| AMD Radeon R9 290 |
8.81 |
100.11 % |
| nVidia GeForce GTX 780 |
8.80 |
100.00 % |
| AMD Radeon R9 280X |
7.99 |
90.80 % |
| PowerColor Radeon R9 285 TurboDuo |
7.00 |
79.55 % |
| ASUS Strix OC Edition GeForce GTX 960 |
5.00 |
56.82 % |
| Gigabyte G1 Gaming GeForce GTX 960 |
5.00 |
56.82 % |
| nVidia GeForce GTX 680 |
5.00 |
56.82 % |
|
More is better |
Far Cry 4 Settings |
| 1080p |
1440p |
2160p |
- Graphics Quality: Custom
- Motion Blur : On
- Textures: Ultra
- VSync: Off
- Shadow: Ultra
- Post FX: Ultra
- Geometry: Ultra
- Vegetation: Ultra
- Terrain: Ultra
- Water: Ultra
- Environment: Ultra
- Ambient Occlusion: HBAO+
- Anti-Aliasing Quality: MSAA-4X
- Godrays: Volumetric fog
- Fur : On
- Trees relief : On
|
[pagebreak]
Power Consumption
| Power Consumption Idle* |
Watts |
% |
| ASUS Strix OC Edition GeForce GTX 960 |
60 |
131.67 % |
| nVidia GeForce GTX 680 |
65 |
121.54 % |
| Gigabyte G1 Gaming GeForce GTX 960 |
67 |
117.91 % |
| PowerColor Radeon R9 285 TurboDuo |
68 |
116.18 % |
| nVidia GeForce GTX 970 |
69 |
114.49 % |
| ASUS GeForce GTX 980 Poseidon Platinum |
70 |
112.85 % |
| ASUS Strix OC Edition GeForce GTX 980 |
71 |
111.27 % |
| AMD Radeon R9 280X |
72 |
109.72 % |
| Gigabyte G1 Gaming GeForce GTX 980 |
73 |
108.22 % |
| MSI GTX 980 Gaming 4G |
74 |
106.76 % |
| nVidia GeForce GTX TITAN |
74 |
106.76 % |
| ASUS GeForce GTX 980 Matrix Platinum |
75 |
105.33 % |
| AMD Radeon R9 290 |
76 |
103.95 % |
| ASUS Radeon R9 290 DirectCU II OC |
78 |
101.28 % |
| ASUS Radeon R9 290X Matrix Platinum |
78 |
101.28 % |
| nVidia GeForce GTX 780 |
79 |
100.00 % |
| nVidia GeForce GTX 780 Ti |
81 |
97.53 % |
| AMD Radeon R9 290X |
92 |
85.87 % |
| *Entire system |
Less is better |
| Power Consumption Load (FurMark)* |
Watts |
% |
| ASUS Strix OC Edition GeForce GTX 960 |
207 |
145.89 % |
| nVidia GeForce GTX 970 |
210 |
143.81 % |
| Gigabyte G1 Gaming GeForce GTX 960 |
220 |
137.27 % |
| nVidia GeForce GTX 980 |
222 |
136.04 % |
| ASUS GeForce GTX 980 Poseidon Platinum |
224 |
134.82 % |
| ASUS Strix OC Edition GeForce GTX 980 |
225 |
134.22 % |
| MSI GTX 980 Gaming 4G |
235 |
128.51 % |
| Gigabyte G1 Gaming GeForce GTX 980 |
238 |
126.89 % |
| AMD Radeon R9 280X |
240 |
125.83 % |
| ASUS GeForce GTX 980 Matrix Platinum |
265 |
114.40 % |
| PowerColor Radeon R9 285 TurboDuo |
264 |
114.39 % |
| nVidia GeForce GTX 680 |
290 |
104.14 % |
| nVidia GeForce GTX 780 |
302 |
100.00 % |
| nVidia GeForce GTX 780 Ti |
310 |
97.42 % |
| AMD Radeon R9 290 |
318 |
94.97 % |
| ASUS Radeon R9 290 DirectCU II OC |
322 |
93.79 % |
| nVidia GeForce GTX TITAN |
325 |
92.92 % |
| ASUS Radeon R9 290X Matrix Platinum |
351 |
86.04 % |
| AMD Radeon R9 290X |
353 |
85.55 % |
| *Entire system |
Less is better |
[pagebreak]
Temperatures / Noise Levels
Fan Speed
| Model |
Auto |
50% |
70% |
100% |
| ASUS GeForce GTX 980 Matrix Platinum |
1'080 |
1'100 |
2'100 |
3'000 |
| ASUS GeForce GTX 980 Poseidon Platinum |
1'050 |
1'560 |
2'310 |
2'900 |
| ASUS Radeon R9 290 DirectCU II OC |
1'025 |
1'805 |
2'575 |
3'040 |
| ASUS Radeon R9 290X Matrix Platinum |
1'035 |
1'875 |
2'630 |
3'000 |
| ASUS Strix OC Edition GeForce GTX 960 |
0 |
1'620 |
2'350 |
3'350 |
| ASUS Strix OC Edition GeForce GTX 980 |
0 |
1'500 |
2'150 |
3'010 |
| AMD Radeon R9 290X |
1'150 |
1'970 |
2'680 |
3'040 |
| AMD Radeon R9 290 |
980 |
2'620 |
3'925 |
5'275 |
| AMD Radeon R9 280X |
1'035 |
2'045 |
2'920 |
4'140 |
| Gigabyte G1 Gaming GeForce GTX 960 |
0 |
1'600 |
2'250 |
3'200 |
| Gigabyte G1 Gaming GeForce GTX 980 |
1'035 |
2'070 |
2'900 |
4'160 |
| MSI GTX 980 Gaming 4G |
0 |
1'155 |
1'600 |
2'270 |
| nVidia GeForce GTX TITAN |
1'180 |
1'960 |
3'040 |
4'150 |
| nVidia GeForce GTX 970 |
1'020 |
1'475 |
2'075 |
2'850 |
| nVidia GeForce GTX 980 |
1'050 |
1'560 |
2'310 |
2'900 |
| nVidia GeForce GTX 780 Ti |
1'072 |
1'500 |
2'100 |
2'870 |
| nVidia GeForce GTX 780 |
1'250 |
2'060 |
2'950 |
4'240 |
| nVidia GeForce GTX
680 |
1'020 |
1'860 |
2'870 |
4'230 |
| PowerColor Radeon R9 285 TurboDuo |
1'330 |
3'010 |
4'180 |
5'040 |
| |
Less is better |
Idle Temperature
| Model |
Auto |
50% |
70% |
100% |
| ASUS GeForce GTX 980 Matrix Platinum |
30 |
29 |
28 |
27 |
| ASUS GeForce GTX 980 Poseidon Platinum |
25 |
25 |
25 |
25 |
| ASUS Radeon R9 290 DirectCU II OC |
38 |
36 |
35 |
34 |
| ASUS Radeon R9 290X Matrix Platinum |
37 |
36 |
35 |
34 |
| ASUS Strix OC Edition GeForce GTX 960 |
31 |
28 |
27 |
26 |
| ASUS Strix OC Edition GeForce GTX 980 |
33 |
28 |
28 |
27 |
| AMD Radeon R9 290X |
33 |
33 |
32 |
31 |
| AMD Radeon R9 290 |
44 |
40 |
38 |
35 |
| AMD Radeon R9 280X |
35 |
32 |
31 |
30 |
| Gigabyte G1 Gaming GeForce GTX 960 |
30 |
28 |
26 |
24 |
| Gigabyte G1 Gaming GeForce GTX 980 |
34 |
31 |
30 |
28 |
| MSI GTX 980 Gaming 4G |
38 |
34 |
32 |
30 |
| nVidia GeForce GTX TITAN |
35 |
35 |
34 |
32 |
| nVidia GeForce GTX 970 |
37 |
35 |
32 |
30 |
| nVidia GeForce GTX 980 |
36 |
36 |
34 |
32 |
| nVidia GeForce GTX 780 Ti |
32 |
31 |
30 |
29 |
| nVidia GeForce GTX 780 |
32 |
30 |
29 |
28 |
| nVidia GeForce GTX
680 |
32 |
31 |
31 |
29 |
| PowerColor Radeon R9 285 TurboDuo |
32 |
32 |
30 |
28 |
| |
Less is better |
Full Temperature
| Model |
Auto |
50% |
70% |
100% |
| ASUS GeForce GTX 980 Matrix Platinum |
62 |
59 |
54 |
50 |
| ASUS GeForce GTX 980 Poseidon Platinum |
47 |
47 |
47 |
47 |
| ASUS Radeon R9 290 DirectCU II OC |
72 |
79 |
75 |
68 |
| ASUS Radeon R9 290X Matrix Platinum |
88 |
85 |
82 |
78 |
| ASUS Strix OC Edition GeForce GTX 960 |
63 |
58 |
55 |
52 |
| ASUS Strix OC Edition GeForce GTX 980 |
67 |
58 |
54 |
52 |
| AMD Radeon R9 290X |
90 |
91 |
86 |
83 |
| AMD Radeon R9 290 |
94 |
85 |
74 |
67 |
| AMD Radeon R9 280X |
80 |
77 |
74 |
70 |
| Gigabyte G1 Gaming GeForce GTX 960 |
59 |
55 |
53 |
50 |
| Gigabyte G1 Gaming GeForce GTX 980 |
72 |
79 |
75 |
68 |
| MSI GTX 980 Gaming 4G |
66 |
57 |
52 |
50 |
| nVidia GeForce GTX TITAN |
84 |
75 |
70 |
67 |
| nVidia GeForce GTX 970 |
67 |
58 |
54 |
52 |
| nVidia GeForce GTX 980 |
67 |
59 |
55 |
53 |
| nVidia GeForce GTX 780 Ti |
90 |
85 |
73 |
65 |
| nVidia GeForce GTX 780 |
86 |
81 |
75 |
66 |
| nVidia GeForce GTX
680 |
84 |
77 |
70 |
63 |
| PowerColor Radeon R9 285 TurboDuo |
80 |
70 |
66 |
61 |
| |
Less is better |
Temperature and fan speed under BattleField 4
| Model |
Temp |
| ASUS GeForce GTX 980 Matrix Platinum |
58 |
| ASUS GeForce GTX 980 Poseidon Platinum |
46 |
| ASUS Radeon R9 290 DirectCU II OC |
68 |
| ASUS Radeon R9 290X Matrix Platinum |
72 |
| ASUS Strix OC Edition GeForce GTX 960 |
58 |
| ASUS Strix OC Edition GeForce GTX 980 |
66 |
| AMD Radeon R9 290X |
79 |
| AMD Radeon R9 290 |
80 |
| AMD Radeon R9 280X |
77 |
| Gigabyte G1 Gaming GeForce GTX 960 |
57 |
| Gigabyte G1 Gaming GeForce GTX 980 |
58 |
| MSI GTX 980 Gaming 4G |
63 |
| nVidia GeForce GTX TITAN |
71 |
| nVidia GeForce GTX 970 |
62 |
| nVidia GeForce GTX 980 |
64 |
| nVidia GeForce GTX 780 Ti |
70 |
| nVidia GeForce GTX 780 |
66 |
| nVidia GeForce GTX
680 |
75 |
| PowerColor Radeon R9 285 TurboDuo |
76 |
| |
Less is better |
Noise Level
| Model |
Auto |
50% |
70% |
100% |
| ASUS GeForce GTX 980 Matrix Platinum |
33,1 |
38,9 |
44,1 |
51,6 |
| ASUS GeForce GTX 980 Poseidon Platinum |
0 |
0 |
0 |
0 |
| ASUS Radeon R9 290 DirectCU II OC |
32,9 |
41,6 |
49,2 |
51,5 |
| ASUS Radeon R9 290X Matrix Platinum |
33 |
41,2 |
49,6 |
52,7 |
| ASUS Strix OC Edition GeForce GTX 960 |
0 |
32.4 |
37.6 |
44.1 |
| ASUS Strix OC Edition GeForce GTX 980 |
0 |
36,8 |
41,2 |
50,9 |
| AMD Radeon R9 290X |
33,8 |
48,9 |
59,1 |
65,1 |
| AMD Radeon R9 290 |
33,6 |
48,7 |
58,2 |
64,9 |
| AMD Radeon R9 280X |
38 |
40,6 |
50,7 |
63,7 |
| Gigabyte G1 Gaming GeForce GTX 960 |
0 |
33.8 |
38.0 |
43.9 |
| Gigabyte G1 Gaming GeForce GTX 980 |
32 |
36,8 |
43,5 |
51,7 |
| MSI GTX 980 Gaming 4G |
0 |
35,7 |
41,8 |
49,7 |
| nVidia GeForce GTX TITAN |
33,9 |
37,8 |
53,8 |
61,2 |
| nVidia GeForce GTX 970 |
34,6 |
41 |
45,5 |
53,8 |
| nVidia GeForce GTX 980 |
34,7 |
41,1 |
45,7 |
54 |
| nVidia GeForce GTX 780 Ti |
33,2 |
39,6 |
48,5 |
55,9 |
| nVidia GeForce GTX 780 |
33,2 |
39,8 |
48,4 |
56,2 |
| nVidia GeForce GTX
680 |
33,5 |
37,6 |
45,4 |
51,9 |
| PowerColor Radeon R9 285 TurboDuo |
32,8 |
37,4 |
47,9 |
56,7 |
| |
Less is better |
[pagebreak]
Performance/Price &
Performance/Watt
| |
Performance Index |
Price/Performance Factor |
| AMD Radeon R9 280X |
81.28 |
3.64 |
| nVidia GeForce GTX 970 |
110.58 |
3.58 |
| AMD Radeon R9 290 |
103.54 |
3.35 |
| PowerColor Radeon R9 285 TurboDuo |
67.75 |
3.26 |
| ASUS Radeon R9 290 DirectCU II OC |
106.94 |
3.20 |
| AMD Radeon R9 290X |
115.77 |
3.18 |
| ASUS Strix OC Edition GeForce GTX 960 |
67.33 |
2.94 |
| Gigabyte G1 Gaming GeForce GTX 960 |
66.04 |
2.88 |
| Gigabyte G1 Gaming GeForce GTX 980 |
144.71 |
2.64 |
| nVidia GeForce GTX 780 |
100.00 |
2.63 |
| nVidia GeForce GTX 980 |
133.19 |
2.62 |
| MSI GTX 980 Gaming 4G |
140.21 |
2.53 |
| ASUS Strix OC Edition GeForce GTX 980 |
140.12 |
2.53 |
| nVidia GeForce GTX 780 Ti |
125.46 |
2.33 |
| ASUS GeForce GTX 980 Poseidon Platinum |
141.19 |
2.29 |
| ASUS Radeon R9 290X Matrix Platinum |
118.26 |
2.15 |
| ASUS GeForce GTX 980 Matrix Platinum |
147.88 |
2.12 |
| nVidia GeForce GTX 680 |
57.84 |
1.57 |
| nVidia GeForce GTX TITAN |
110.19 |
1.18 |
[pagebreak]
Price
| |
Price |
| ASUS
GeForce GTX 980 Matrix Platinum |
|
| ASUS
GeForce GTX 980 Poseidon Platinum |
|
| ASUS Radeon R9 290 DirectCU II OC |
|
| ASUS Radeon R9 290X Matrix Platinum |
|
| ASUS Strix OC Edition GeForce GTX 960 |
|
| ASUS Strix OC Edition GeForce GTX 980 |
|
| AMD Radeon R9 290X |
|
| AMD Radeon R9 290 |
|
| AMD Radeon
R9 280X |
|
| Gigabyte G1 Gaming GeForce GTX 980 |
|
| Gigabyte G1 Gaming GeForce GTX 960 |
|
| MSI GTX 980 Gaming 4G |
|
| nVidia GeForce GTX TITAN |
|
| nVidia GeForce GTX 970 |
|
| nVidia GeForce GTX 980 |
|
| nVidia GeForce GTX 780 Ti |
|
| nVidia GeForce GTX 780 |
|
| nVidia GeForce GTX
680 |
|
| PowerColor Radeon R9 285 TurboDuo |
|
[pagebreak]
Conclusion
|
General |
|
+ |
- |
The new Gigabyte G1
Gaming GTX 960 did well in our tests, had a decent factory
overclock and ships with a really good custom Windforce 3X 300W triple fan cooler.
The manufacturing quality is on a high level and the backplate is great
looking. The new BIOS for controlling fan in idle and load is yet
another great addtion.
On the other hand, we would have really liked that Gigabyte paid more
attention to the factory overclocking on this specific card, with
an additional 6 pin power and in combination with the Windforce 3X cooler the card
would be able to easily
run even with an higher GPU frequency. Despite doing a good job in keeping the
temperatures of the graphics card down we would appreciate it if the cooler
was just a tad bit less noisier under
load. |
|
- Performance
- Factory Overclocking
- Cooling
- Design
- Backplate
- Noise level |
|
| |
| Cooling / Noise
Level |
|
+ |
- |
| As noted earlier, the Windforce 3X 300W triple-fan
cooler is very good and definitely runs circles around the reference
solution, Gigabyte made a new BIOS to make the card run even more silent,
especiall in
case of 2D or light gaming. The fans start spinning when power
consumption of the card is
over 60W or temprature near 62°C. Later on the fans are turned off, when
the GPU hits 43°C or less than 32 Watt power consumption. |
|
- Inaudible in
2D |
|
| |
| Performance |
|
+ |
- |
The performance is where the G1 Gaming GTX 960
is on a competitive level. There is a really decent factory overclocking
and the card hits at least 1392 MHz in games. Nevertheless we would have
love to see Gigabyte push the boundries even further sind this card
comes with a rather beefy power design if you consider that the standard
TDP for a GTX 960 is set at 120 Watt.
The power consumption of the Gigabyte G1 Gaming GTX 960 is good
in idle with power consumption of the entire setup at 67W. Under load,
the new G1 Gaming GTX 960 pulls 220 Watts. Overall this is an energy
efficient card, but since there is a relatively strong power design also
power consumption is a bit higher than with other GTX 960 graphics
cards. |
|
- Performance
-Overclocking capability |
-
Power consumption |
| |
| Recommendation /
Price |
|
+ |
- |
At the moment we find this card listed in Europe
for 229 Euro. Shortly after the launch the price has dropped by quite a
margin, which makes this card even more interesting.
The Ggiabyte GTX 960 G1 Gaming is certainly a good card with capable
cooler and surpisingly beefy power design. Should you be looking for a
great GTX 960 graphics cards then this is an excellent
choice. |
|
- Gaming
- Overclocking |
|
| |
| We gave the G1 Gaming GTX 960 from
Gigabyte 4.5 out of 5 stars. |
| |
| Buy in Switzerland |
Buy in Germany |
Buy in Italy |
Buy in France |
Buy in UK |
Buy in US |
|
|
|
|
|
|
|
 Article in English
 Artikel in Deutsch
 Article en français
 Articolo in italiano