MSI GeForce GTX 770 Lightning Review
Category : NVIDIA
Published by Christian Ney on 07.08.13
 With their GeForce GTX 770 Lightning, MSI has another super weapon in it's back pack, when it comes to extra powerful graphics cards. Usually the Lightning cards are the cream of the crop and it's hard for any other manufacturer to keep up with MSI, when it comes to high-end VGA's. The question that remains then, what will the GTX 770 Lightning be like? Will it raise the bar once more or is MSI going to loose ground to the competition?
 Article in English Article in English |
 Artikel in Deutsch Artikel in Deutsch |
 Article en français Article en français |
 Articolo in italiano Articolo in italiano |

On the following pages we will show you the strengths and weaknesses of the MSI GTX 770 Lightning.
Technical Data / Specifications
With the MSI GeForce GTX 770 Lightning OC you get a card which features a custom PCB as well as a custom cooler. The ASIC quality measured on our sample was 75.0 % which is quite low but it's good news since overclockers will have more fun feeding this beast with liquid nitrogen.
About ASIC quality:

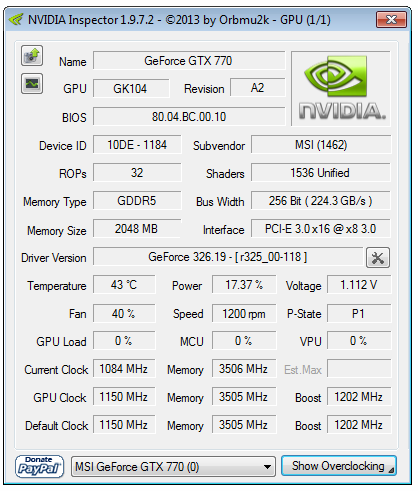
MSI is using the latest NVIDIA Kepler GK104-425-A2 chip, which is manufactured by TSMC with the latest 28 nanometer process technology. With the GeForce GTX 770 you get eight SMX units which results in 1'536 CUDA cores. Following the specs further, there are 128 TMUs, 32 ROPs, a 256 bit wide memory interface and 2 Gigabyte of GDDR5 memory, which is clocked at 7'000 MHz. In the end there is a memory bandwidth of 224.4 Gigabyte per second. Concerning the GPU's clock speeds it runs at a base clock of 1'150 MHz and a boost clock of 1'202 MHz. During our tests the highest boost clock we measured was 1'228 MHz, which happened to be the average boost clock too. In other words under load the GPU was always running at 1'228 MHz.
The GTX 770 also supports GPU Boost 2.0. The very first version of GPU Boost stopped overclocking the GPU when a certain power target was hit. This new, second version of GPU Boost stops overclocking the card, when a certain temperature is being reached. This makes sense since the temperature is the bigger inhibitor than the power target in most cases. In this case the temperature target is 80 degrees Celsius. In other words, as long as the GPU runs below 80°C it will keep overclocking until the maximum frequency has been reached. This is why in our case the average boost clock was 26 MHz higher than the typical boost clock the manufacturer advertises, the card never was near the target temp.

| nVidia GeForce | MSI Lightning | ASUS DCU 2 OC | GeForce GTX 770 | GeForce GTX 680 |
| Chip | GK104-425-A2 | GK104-425-A2 | GK104-425-A2 | GK104 |
| Process | 28 nm | 28 nm | 28 nm | 28 nm |
| Transistors | 3.54 billion | 3.54 billion | 3.54 billion | 3.54 billion |
| GPU clock | 1'150 MHz | 1'059 MHz | 1'046 MHz | 1'006 MHz |
| GPU Boost clock | 1'202 MHz | 1'111 MHz | 1'085 MHz | 1'059 MHz |
| Memory GDDR5 | 2'048 MB | 2'048 MB | 2'048 MB | 2'048 MB |
| Memory clock | 1'750 (7'000) MHz | 1'750 (7'000) MHz | 1'750 (7'000) MHz | 1'500 (6'000) MHz |
| Memory interface | 256 Bit | 256 Bit | 256 Bit | 256 Bit |
| Memory bandwidth | 224'400 MB/s | 224'400 MB/s | 224'400 MB/s | 192'300 MB/s |
| TMUs | 128 | 128 | 128 | 128 |
| Shader Cores | 1'536 (8 SMX) | 1'536 (8 SMX) | 1'536 (8 SMX) | 1'536 (8 SMX) |
| ROPs | 32 | 32 | 32 | 32 |
| TDP | 260 Watt | 230 Watt | 230 Watt | 195 Watt |
| PCB Type | Custom Design | Custom Design | Reference Design | Reference Design |
| Lenght (PCB - Total) | 28.2 - 29.3 cm | 27.0 - 27.0 cm | 26.7 - 26.7 cm | 25.6 - 25.6 cm |
| Height (PCB - Total) | 13.0 - 14.0 cm | xx.0 - xx.0 cm | 11.0 - 11.0 cm | 11.0 - 11.0 cm |
| Slots | 2 | 2 | 2 | 2 |
| Cooler | MSI Twin Frozr IV | ASUS Direct CU II | NVIDIA Reference | NVIDIA Reference |
| MSRP | $XXX | $XXX | $399 | $499 |
MSI decided to equip its GeForce GTX 770 Lightning with the latest version IV of their famous Twin Frozr cooler. In this case you get three six millimeter, nickel-plated copper heatpipes, which are surrounded by two eight millimeter ones. The latter are in contact with the GPU through a nickel-plated copper base plate. This one, unfortunately, doesn't have a mirror finish. Soldered to the heatpipes you find the fin stack which is being provided with fresh air via two 100mm PWM DC brushless two ball bearing fans. Those are manufactured by Power Logic and carry the model number PLD00015B12H.

|   
|
A closer look at the PCB shows that MSI equipped this card with a digital 12 phase PWM design. In this case, the GPU gets eight phases, twice as much as on the reference model. The memory can rely on three phases, which take the power directly from the 8-pin power connector. Compared to the reference analog 2-phase PCI-E shared power design, this is by far the better way to implement it. The remaining phase feeds the PLL.
This card also features an unlocked BIOS (LN2 BIOS) that can be selected via a DIP switch, located at the top end of the card. Switching to this BIOS will disable all protections such as ASP (Active Phase Switching), higher the OCP (Over Current Protection) from 380 to 800W and higher the TDP from 300 to 900W. There are also two heatsink plates that keeps the card safe and cools the memory chips as well as the MOSFETs.
Component wise, the Lightning complies with MSI's Military Class III Components standard. It doesn't mean you will find military/NASA class components on the PCB, otherwise the card would have been so expensive you couldn't afford it. Still you find top quality components such as Golden SSC (trio R17 1320), CopperMOS (IR 8304 ARJH 1234 & IR 8327 9SUF 1228), All Hi-c CAPs for GPU (470 3330M) and Dark Solid CAPs (FP5K 35Ao 271 16).
Apart from that the Lightning also features triple overvoltage for GPU, memory and PLL via AfterBurner and voltage read-out points for CPU, memory and PLL located at the right end of the PCB.
Checking the voltage regulation chips we find a digital multi-phase buck controller CHL8318 from CHiL for the GPU and a three-phase PWM controller uP1612Q for the memory.

|   
|
The memory chips used are made by Samsung and carry the model number K4G20325FD-FC28. They are specified to run at 1'750 MHz (7'000 MHz effective).

Preview


Delivery


The card ships well bolstered in a foam made mold. Bundled with the graphics card there is a user guide, a driver CD, that includes the overclocking tool AfterBurner, two power converters (6-Pin-PCIe to 1x8-Pin-PCIe), a DVI to VGA adapater, the V-Check cables and a long, flexible SLI bridge.
Test Setup
Hardware
| Mainboard |
|
| CPUs |
|
| Memory |
|
| Graphic Cards (Driver) |
|
| Drivers |
|
| Games and OS |
|
| HDD |
|
| PSU |
|


3DMark - Fire Strike Performance

| Graphics Cards | Score | Graphics Score |
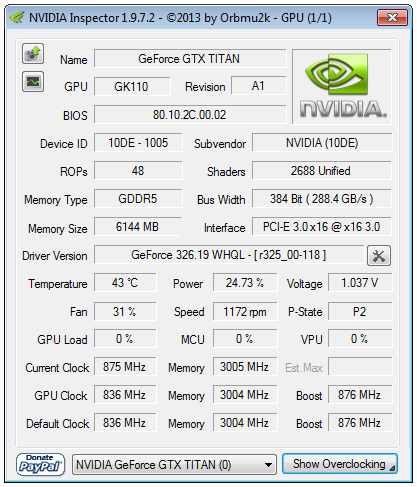
| nVidia GeForce GTX TITAN | 8'296 | 9'298 |
| nVidia GeForce GTX 780 | 7'752 | 8'582 |
| MSI GeForce GTX 770 Lightning | 7'224 | 8'132 |
| AMD Radeon HD 7970 GHz Edition | 6'979 | 7'733 |
| AMD Radeon HD 6990 | 6'395 | 7'294 |
| ASUS GeForce GTX 770 DCU 2 OC | ||
| nVidia GeForce GTX 770 | 6'581 | 7'293 |
| nVidia GeForce GTX 680 | 6'374 | 7'067 |
| AMD Radeon HD 7970 | 6'474 | 7'052 |
| nVidia GeForce GTX 670 | 5'567 | 6'046 |
| nVidia GeForce GTX 760 | 5'164 | 5'560 |
| AMD Radeon HD 7870 | 4'947 | 5'339 |
| nVidia GeForce GTX 660 Ti | 4'839 | 5'227 |
| nVidia GeForce GTX 580 | 4'547 | 4'979 |
| AMD Radeon HD 7850 | 4'555 | 4'880 |
| nVidia GeForce GTX 660 | 4'353 | 4'637 |
| nVidia GeForce GTX 650 Ti Boost | 3'708 | 3'904 |
| AMD Radeon HD 6970 | 3'731 | 3'862 |
| AMD Radeon HD 6950 | 3'342 | 3'453 |
| nVidia GeForce GTX 650 Ti | 2'998 | 3'152 |
| AMD Radeon HD 6870 | 2'995 | 3'100 |
| More is better | ||

3DMark - Fire Strike Extreme

| Graphics Cards | Score | Graphics Score |
| nVidia GeForce GTX TITAN | 4'215 | 4'378 |
| nVidia GeForce GTX 780 | 3'931 | 4'054 |
| MSI GeForce GTX 770 Lightning | 3'584 | 3'763 |
| AMD Radeon HD 7970 GHz Edition | 3'418 | 3'535 |
| nVidia GeForce GTX 770 | 3'275 | 3'419 |
| AMD Radeon HD 6990 | 3'250 | 3'352 |
| nVidia GeForce GTX 680 | 3'160 | 3'292 |
| AMD Radeon HD 7970 | 3'151 | 3'210 |
| nVidia GeForce GTX 670 | 2'758 | 2'837 |
| nVidia GeForce GTX 760 | 2'556 | 2'609 |
| AMD Radeon HD 7870 | 2'407 | 2'471 |
| nVidia GeForce GTX 660 Ti | 2'342 | 2'412 |
| nVidia GeForce GTX 580 | 2'216 | 2'349 |
| AMD Radeon HD 7850 | 2'218 | 2'253 |
| nVidia GeForce GTX 660 | 2'136 | 2'168 |
| nVidia GeForce GTX 650 Ti Boost | 1'812 | 1'827 |
| AMD Radeon HD 6970 | 1'783 | 1'758 |
| AMD Radeon HD 6950 | 1'586 | 1'556 |
| AMD Radeon HD 6870 | 961 | 927 |
| nVidia GeForce GTX 650 Ti | 9'58 | 910 |
| More is better | ||

Unigine Heaven 4.0 Extreme Preset

| Graphics Cards | Score | fps |
| nVidia GeForce GTX 780 | 1'641 | 65.2 |
| nVidia GeForce GTX TITAN | 1'639 | 65.1 |
| MSI GeForce GTX 770 Lightning | 1'310 | 52.0 |
| nVidia GeForce GTX 770 | 1'203 | 47.8 |
| AMD Radeon HD 6990 | 1'181 | 46.9 |
| nVidia GeForce GTX 680 | 1'162 | 46.1 |
| AMD Radeon HD 7970 GHz Edition | 1'118 | 44.4 |
| nVidia GeForce GTX 670 | 1'027 | 40.8 |
| AMD Radeon HD 7970 | 1'018 | 40.4 |
| nVidia GeForce GTX 760 | 951 | 37.7 |
| nVidia GeForce GTX 580 | 914 | 36.3 |
| nVidia GeForce GTX 660 Ti | 867 | 34.4 |
| AMD Radeon HD 7870 | 822 | 32.6 |
| nVidia GeForce GTX 660 | 803 | 31.9 |
| AMD Radeon HD 7850 | 752 | 29.9 |
| nVidia GeForce GTX 650 Ti Boost | 703 | 27.9 |
| AMD Radeon HD 6970 | 610 | 24.2 |
| AMD Radeon HD 6950 | 555 | 22.0 |
| AMD Radeon HD 6870 | 504 | 20.0 |
| nVidia GeForce GTX 650 Ti | 496 | 19.7 |
| More is better | ||
BattleField 3

| High Preset, 1920x1080, 4xMSAA, Ultra, SSAO | Average FPS |
| nVidia GeForce GTX TITAN | 90.6 |
| nVidia GeForce GTX 780 | 86.8 |
| MSI GeForce GTX 770 Lightning | 80.2 |
| AMD Radeon HD 7970 GHz Edition | 79.2 |
| nVidia GeForce GTX 770 | 75.6 |
| AMD Radeon HD 7970 | 70.8 |
| nVidia GeForce GTX 680 | 70.0 |
| AMD Radeon HD 6990 | 65.4 |
| nVidia GeForce GTX 670 | 65.4 |
| nVidia GeForce GTX 760 | 61.2 |
| nVidia GeForce GTX 660 Ti | 55.6 |
| AMD Radeon HD 7870 | 53.8 |
| nVidia GeForce GTX 660 | 50.6 |
| AMD Radeon HD 7850 | 48.2 |
| nVidia GeForce GTX 580 | 47.8 |
| nVidia GeForce GTX 650 Ti Boost | 44.0 |
| AMD Radeon HD 6970 | 35.4 |
| nVidia GeForce GTX 650 Ti | 32.2 |
| AMD Radeon HD 6950 | 31.8 |
| AMD Radeon HD 6870 | 29.6 |
| More is better |

Borderlands 2

| High Preset, 1920x1080, FXAA, no PhsyX, High | Average FPS |
| AMD Radeon HD 6990 | 138.8 |
| nVidia GeForce GTX 780 | 138.0 |
| nVidia GeForce GTX TITAN | 135.6 |
| MSI GeForce GTX 770 Lightning | 129.4 |
| nVidia GeForce GTX 770 | 121.6 |
| nVidia GeForce GTX 680 | 119.2 |
| AMD Radeon HD 7970 GHz Edition | 115.2 |
| nVidia GeForce GTX 670 | 111.0 |
| AMD Radeon HD 7970 | 105.4 |
| nVidia GeForce GTX 760 | 104.4 |
| nVidia GeForce GTX 660 Ti | 95.0 |
| nVidia GeForce GTX 580 | 91.4 |
| nVidia GeForce GTX 660 | 87.4 |
| nVidia GeForce GTX 650 Ti Boost | 76.6 |
| AMD Radeon HD 7870 | 76.6 |
| AMD Radeon HD 6970 | 74.6 |
| AMD Radeon HD 7850 | 73.4 |
| AMD Radeon HD 6950 | 67.0 |
| AMD Radeon HD 6870 | 58.4 |
| nVidia GeForce GTX 650 Ti | 55.6 |
| More is better |


Bioshock Infinite - Benchmark

| Ultra Preset, 1920x1080, AA, no DDOF | Average FPS |
| nVidia GeForce GTX TITAN | 93.02 |
| nVidia GeForce GTX 780 | 87.24 |
| MSI GeForce GTX 770 Lightning | 83.02 |
| AMD Radeon HD 6990 | 77.57 |
| AMD Radeon HD 7970 GHz Edition | 76.79 |
| nVidia GeForce GTX 770 | 75.83 |
| nVidia GeForce GTX 680 | 73.67 |
| AMD Radeon HD 7970 | 69.80 |
| nVidia GeForce GTX 670 | 65.82 |
| nVidia GeForce GTX 760 | 60.84 |
| nVidia GeForce GTX 660 Ti | 58.98 |
| nVidia GeForce GTX 660 | 51.00 |
| nVidia GeForce GTX 580 | 50.74 |
| AMD Radeon HD 7870 | 50.28 |
| AMD Radeon HD 7850 | 47.07 |
| nVidia GeForce GTX 650 Ti Boost | 44.44 |
| AMD Radeon HD 6970 | 42.17 |
| AMD Radeon HD 6950 | 37.23 |
| nVidia GeForce GTX 650 Ti | 34.98 |
| AMD Radeon HD 6870 | 32.61 |
| More is better |

Crysis 3

| High Preset, 1920x1080, 8xMSAA, Very High | Average FPS |
| nVidia GeForce GTX TITAN | 32.8 |
| nVidia GeForce GTX 780 | 31.2 |
| MSI GeForce GTX 770 Lightning | 27.2 |
| AMD Radeon HD 6990 | 27.2 |
| nVidia GeForce GTX 680 | 25.0 |
| nVidia GeForce GTX 770 | 24.8 |
| nVidia GeForce GTX 670 | 22.8 |
| nVidia GeForce GTX 760 | 21.2 |
| AMD Radeon HD 7970 GHz Edition | 20.2 |
| nVidia GeForce GTX 660 Ti | 18.8 |
| AMD Radeon HD 7970 | 18.2 |
| nVidia GeForce GTX 660 | 17.4 |
| nVidia GeForce GTX 580 | 17.2 |
| nVidia GeForce GTX 650 Ti Boost | 15.4 |
| AMD Radeon HD 6970 | 14.8 |
| AMD Radeon HD 7870 | 14.4 |
| AMD Radeon HD 7850 | 13.2 |
| AMD Radeon HD 6950 | 13.2 |
| nVidia GeForce GTX 650 Ti | 10.8 |
| AMD Radeon HD 6870 | 9.0 |
| More is better |


Call of Duty Black Ops 2

| High Preset, 1920x1080, 8xMSAA, High | Average FPS |
| MSI GeForce GTX 770 Lightning | 118.2 |
| AMD Radeon HD 6990 | 115.8 |
| nVidia GeForce GTX TITAN | 114.8 |
| nVidia GeForce GTX 780 | 108.2 |
| nVidia GeForce GTX 770 | 105.8 |
| nVidia GeForce GTX 680 | 91.8 |
| AMD Radeon HD 7970 GHz Edition | 89.8 |
| AMD Radeon HD 7970 | 82.0 |
| nVidia GeForce GTX 670 | 82.0 |
| nVidia GeForce GTX 760 | 77.6 |
| nVidia GeForce GTX 580 | 69.6 |
| AMD Radeon HD 7870 | 67.8 |
| nVidia GeForce GTX 660 Ti | 67.8 |
| AMD Radeon HD 7850 | 66.0 |
| nVidia GeForce GTX 660 | 63.2 |
| AMD Radeon HD 6970 | 60.8 |
| AMD Radeon HD 6950 | 55.8 |
| nVidia GeForce GTX 650 Ti Boost | 55.8 |
| AMD Radeon HD 6870 | 52.2 |
| nVidia GeForce GTX 650 Ti | 40.4 |
| More is better |

DIRT Showdown - Benchmark

| High Preset, 1920x1080, 8xMSAA, Ultra | Average FPS |
| nVidia GeForce GTX TITAN | 86.32 |
| AMD Radeon HD 7970 GHz Edition | 80.97 |
| nVidia GeForce GTX 780 | 80.17 |
| AMD Radeon HD 6990 | 78.18 |
| AMD Radeon HD 7970 | 74.44 |
| MSI GeForce GTX 770 Lightning | 70.66 |
| nVidia GeForce GTX 770 | 65.98 |
| nVidia GeForce GTX 680 | 65.27 |
| AMD Radeon HD 7870 | 63.81 |
| nVidia GeForce GTX 670 | 58.42 |
| AMD Radeon HD 7850 | 56.77 |
| nVidia GeForce GTX 760 | 52.89 |
| nVidia GeForce GTX 660 Ti | 52.75 |
| nVidia GeForce GTX 580 | 48.69 |
| nVidia GeForce GTX 660 | 44.83 |
| AMD Radeon HD 6970 | 44.63 |
| AMD Radeon HD 6950 | 39.21 |
| nVidia GeForce GTX 650 Ti Boost | 37.34 |
| nVidia GeForce GTX 650 Ti | 30.2 |
| AMD Radeon HD 6870 | 30.09 |
| More is better |


Far Cry 3
| High Preset, 1920x1080, 8xMSAA, Ultra | Average FPS |
| nVidia GeForce GTX TITAN | 50.4 |
| nVidia GeForce GTX 780 | 47.2 |
| MSI GeForce GTX 770 Lightning | 40.0 |
| AMD Radeon HD 6990 | 39.8 |
| nVidia GeForce GTX 770 | 38.0 |
| nVidia GeForce GTX 680 | 36.2 |
| nVidia GeForce GTX 670 | 32.2 |
| AMD Radeon HD 7970 GHz Edition | 31.0 |
| nVidia GeForce GTX 760 | 29.4 |
| AMD Radeon HD 7970 | 27.8 |
| nVidia GeForce GTX 660 Ti | 27.6 |
| nVidia GeForce GTX 580 | 25.0 |
| nVidia GeForce GTX 660 | 24.6 |
| AMD Radeon HD 7870 | 22.6 |
| AMD Radeon HD 6970 | 20.6 |
| nVidia GeForce GTX 650 Ti Boost | 21.4 |
| AMD Radeon HD 7850 | 20.0 |
| AMD Radeon HD 6950 | 17.8 |
| nVidia GeForce GTX 650 Ti | 15.0 |
| AMD Radeon HD 6870 | 13.4 |
| More is better |

Sleeping Dogs - Benchmark

| High Preset, 1920x1080, Extreme, High-Res Textures | Average FPS |
| nVidia GeForce GTX TITAN | 63.0 |
| nVidia GeForce GTX 780 | 58.6 |
| AMD Radeon HD 6990 | 56.5 |
| MSI GeForce GTX 770 Lightning | 56.0 |
| AMD Radeon HD 7970 GHz Edition | 51.8 |
| nVidia GeForce GTX 770 | 51.4 |
| nVidia GeForce GTX 680 | 49.0 |
| AMD Radeon HD 7970 | 47.3 |
| nVidia GeForce GTX 670 | 42.6 |
| nVidia GeForce GTX 760 | 38.9 |
| nVidia GeForce GTX 660 Ti | 38.7 |
| nVidia GeForce GTX 580 | 35.1 |
| AMD Radeon HD 7870 | 33.9 |
| nVidia GeForce GTX 660 | 32.0 |
| AMD Radeon HD 7850 | 30.7 |
| AMD Radeon HD 6970 | 29.9 |
| nVidia GeForce GTX 650 Ti Boost | 26.3 |
| AMD Radeon HD 6950 | 26.0 |
| AMD Radeon HD 6870 | 23.0 |
| nVidia GeForce GTX 650 Ti | 20.1 |
| More is better |

The Elder Scrolls V: Skyrim

| High Preset, 1920x1080, 8xAA, Ultra | Average FPS |
| nVidia GeForce GTX TITAN | 128.0 |
| nVidia GeForce GTX 780 | 122.0 |
| MSI GeForce GTX 770 Lightning | 118.4 |
| AMD Radeon HD 7970 GHz Edition | 109.8 |
| AMD Radeon HD 6990 | 109.2 |
| nVidia GeForce GTX 770 | 109.0 |
| nVidia GeForce GTX 680 | 105.0 |
| AMD Radeon HD 7970 | 98.6 |
| nVidia GeForce GTX 670 | 95.6 |
| nVidia GeForce GTX 760 | 88.0 |
| AMD Radeon HD 7870 | 85.6 |
| nVidia GeForce GTX 580 | 84.8 |
| nVidia GeForce GTX 660 Ti | 80.8 |
| AMD Radeon HD 7850 | 79.2 |
| nVidia GeForce GTX 660 | 73.4 |
| AMD Radeon HD 6970 | 64.4 |
| nVidia GeForce GTX 650 Ti Boost | 63.4 |
| AMD Radeon HD 6950 | 58.2 |
| AMD Radeon HD 6870 | 50.0 |
| nVidia GeForce GTX 650 Ti | 47.6 |
| More is better |

Metro: Last Light - Benchmark

| Very High, 1920x1080, SSAA, DX11 | Average FPS |
| nVidia GeForce GTX TITAN | 40.51 |
| nVidia GeForce GTX 780 | 38.78 |
| MSI GeForce GTX 770 Lightning | 35.64 |
| nVidia GeForce GTX 770 | 32.47 |
| nVidia GeForce GTX 680 | 31.18 |
| AMD Radeon HD 7970 GHz Edition | 28.28 |
| nVidia GeForce GTX 670 | 27.22 |
| AMD Radeon HD 7970 | 26.18 |
| nVidia GeForce GTX 760 | 24.85 |
| nVidia GeForce GTX 660 Ti | 23.89 |
| nVidia GeForce GTX 580 | 23.18 |
| AMD Radeon HD 6990 | 21.94 |
| nVidia GeForce GTX 660 | 20.79 |
| AMD Radeon HD 7870 | 19.19 |
| nVidia GeForce GTX 650 Ti Boost | 17.80 |
| AMD Radeon HD 7850 | 17.75 |
| AMD Radeon HD 6970 | 14.06 |
| nVidia GeForce GTX 650 Ti | 13.78 |
| AMD Radeon HD 6950 | 12.91 |
| AMD Radeon HD 6870 | 10.99 |
| More is better |

Power Consumption

| Power Consumption Idle* | Watts |
| AMD Radeon HD 6990 (Ref) | 75 |
| nVidia GeForce GTX 580 (Ref) | 71 |
| AMD Radeon HD 7970 GHz Edition (ASUS Matrix P.) | 62 |
| AMD Radeon HD 6970 (Ref) | 58 |
| AMD Radeon HD 6950 (Ref) | 58 |
| AMD Radeon HD 6870 (Ref) | 57 |
| nVidia GeForce GTX 780 (ASUS DC2OC) | 56 |
| nVidia GeForce GTX 660 Ti (ASUS DC2T) | 55 |
| MSI GeForce GTX 770 Lightning | 53 |
| nVidia GeForce GTX 770 (MSI Lightning) | 53 |
| nVidia GeForce GTX 670 (ASUS DC2T) | 53 |
| nVidia GeForce GTX 660 (ASUS DC2T) | 52 |
| nVidia GeForce GTX 680 (MSI TF - Ref PCB) | 52 |
| AMD Radeon HD 7970 (XFX DP - Ref PCB) | 50 |
| AMD Radeon HD 7870 (ASUS DC2T V2) | 50 |
| nVidia GeForce GTX TITAN (Ref) | 49 |
| AMD Radeon HD 7850 (ASUS DC2T) | 48 |
| nVidia GeForce GTX 760 (ASUS DC2OC) | 47 |
| nVidia GeForce GTX 650 Ti (ASUS DC2T) | 47 |
| nVidia GeForce GTX 650 Ti Boost (Ref) | 45 |
| *Entire system | Less is better |
| Power Consumption Load (FurMark)* | Watts |
| AMD Radeon HD 6990 (Ref) | 358 |
| nVidia GeForce GTX TITAN (Ref) | 285 |
| nVidia GeForce GTX 780 (ASUS DC2OC) | 235 |
| AMD Radeon HD 7970 GHz Edition (ASUS Matrix P.) | 230 |
| AMD Radeon HD 6970 (Ref) | 215 |
| MSI GeForce GTX 770 Lightning | 211 |
| nVidia GeForce GTX 580 (Ref) | 210 |
| AMD Radeon HD 7970 (XFX DP - Ref PCB) | 200 |
| nVidia GeForce GTX 680 (MSI TF - Ref PCB) | 195 |
| nVidia GeForce GTX 770 (MSI Lightning) | 190 |
| AMD Radeon HD 6950 (Ref) | 184 |
| nVidia GeForce GTX 760 (ASUS DC2OC) | 180 |
| nVidia GeForce GTX 670 (ASUS DC2T) | 177 |
| nVidia GeForce GTX 650 Ti Boost (Ref) | 161 |
| AMD Radeon HD 7870 (ASUS DC2T V2) | 149 |
| nVidia GeForce GTX 660 Ti (ASUS DC2T) | 148 |
| nVidia GeForce GTX 660 (ASUS DC2T) | 148 |
| AMD Radeon HD 6870 (Ref) | 145 |
| AMD Radeon HD 7850 (ASUS DC2T) | 138 |
| nVidia GeForce GTX 650 Ti (ASUS DC2T) | 120 |
| *Entire system | Less is better |
| Difference Idle/LoadDifférence Idle/Charge | Watts |
| AMD Radeon HD 6990 (Ref) | 283 |
| nVidia GeForce GTX TITAN (Ref) | 236 |
| nVidia GeForce GTX 780 (ASUS DC2OC) | 179 |
| AMD Radeon HD 7970 GHz Edition (ASUS Matrix P.) | 168 |
| MSI GeForce GTX 770 Lightning | 158 |
| AMD Radeon HD 6970 (Ref) | 157 |
| AMD Radeon HD 7970 (XFX DP - Ref PCB) | 150 |
| nVidia GeForce GTX 680 (MSI TF - Ref PCB) | 143 |
| nVidia GeForce GTX 580 (Ref) | 139 |
| nVidia GeForce GTX 770 (MSI Lightning) | 137 |
| nVidia GeForce GTX 760 (ASUS DC2OC) | 133 |
| AMD Radeon HD 6950 (Ref) | 126 |
| nVidia GeForce GTX 670 (ASUS DC2T) | 124 |
| nVidia GeForce GTX 650 Ti Boost (Ref) | 116 |
| AMD Radeon HD 7870 (ASUS DC2T V2) | 99 |
| nVidia GeForce GTX 660 (ASUS DC2T) | 96 |
| nVidia GeForce GTX 660 Ti (ASUS DC2T) | 93 |
| AMD Radeon HD 7850 (ASUS DC2T) | 90 |
| AMD Radeon HD 6870 (Ref) | 88 |
| nVidia GeForce GTX 650 Ti (ASUS DC2T) | 73 |
| *Entire system | More is better |

Fan Speed / Noise Level
Fan Speed

Noise Level

For the noise level results, we measured the noise level using a decibel meter (Voltcraft SL-200) located at 1 meter away from the graphics card.
Idle / FurMark / BF3
Idle Temperature

Idle, temperature is taken after 15 minutes @ 30 %, 50 % and 100 % fan speed.
Room Temperature: 25°C
Temperature under Furmark

For FurMark, temperature is taken after 15 minutes of GPU Burn test @ 30 %, 50 % and 100 % fan speed.
We stopped the test when the GPU temperature hit 90°C.
Room Temperature: 25°C
Temperature and fan speed under BattleField 3

For BattleField 3, temperature and fan speed values taken, are the highest achieved after 1 hour gaming @ auto fan speed.
Performance/Watt
| Graphics Cards | Performance Index | Power C. (Watts)* | Performance/Watt*10 |
| nVidia GeForce GTX 770 (MSI Lightning) | 69.98 | 190 | 3.68 |
| MSI GeForce GTX 770 Lightning | 75.87 | 211 | 3.60 |
| nVidia GeForce GTX 660 Ti (ASUS DC2T) | 51.99 | 148 | 3.51 |
| nVidia GeForce GTX 680 (MSI TF - Ref PCB) | 66.70 | 195 | 3.42 |
| nVidia GeForce GTX 670 (ASUS DC2T) | 60.30 | 177 | 3.41 |
| nVidia GeForce GTX 780 (ASUS DC2OC) | 79.80 | 235 | 3.40 |
| AMD Radeon HD 7870 (ASUS DC2T V2) | 48.80 | 149 | 3.28 |
| AMD Radeon HD 7850 (ASUS DC2T) | 45.23 | 138 | 3.28 |
| nVidia GeForce GTX 660 (ASUS DC2T) | 46.52 | 148 | 3.14 |
| nVidia GeForce GTX 760 (ASUS DC2OC) | 55.93 | 180 | 3.11 |
| AMD Radeon HD 7970 (XFX DP - Ref PCB) | 62.05 | 200 | 3.10 |
| AMD Radeon HD 7970 GHz Edition (ASUS Matrix P.) | 68.30 | 230 | 2.97 |
| nVidia GeForce GTX TITAN (Ref) | 85.50 | 285 | 2.93 |
| nVidia GeForce GTX 650 Ti (ASUS DC2T) | 30.06 | 120 | 2.51 |
| nVidia GeForce GTX 650 Ti Boost (Ref) | 40.25 | 161 | 2.50 |
| nVidia GeForce GTX 580 (Ref) | 49.35 | 210 | 2.35 |
| AMD Radeon HD 6870 (Ref) | 30.93 | 145 | 2.13 |
| AMD Radeon HD 6990 (Ref) | 73.04 | 358 | 2.04 |
| AMD Radeon HD 6950 (Ref) | 35.91 | 184 | 1.95 |
| AMD Radeon HD 6970 (Ref) | 40.13 | 215 | 1.87 |
| *Entire system | More is better | Less is better | More is better |
The "Performance Index" value is calculated as the sum of all benchmarks results divided by the amount of games (3DMark and Ungine not included into the calculation).
Performance/Price
| Graphics Cards | Performance Index | Price (€) | Performance/€*10 |
| nVidia GeForce GTX 650 Ti | 30.06 | 98 | 3.07 |
| nVidia GeForce GTX 650 Ti Boost | 40.25 | 132 | 3.05 |
| AMD Radeon HD 7850 | 45.23 | 149 | 3.04 |
| AMD Radeon HD 7870 | 48.80 | 160 | 3.05 |
| nVidia GeForce GTX 660 | 46.52 | 158 | 2.94 |
| nVidia GeForce GTX 660 Ti | 51.99 | 177 | 2.94 |
| AMD Radeon HD 6870 | 30.93 | 110 | 2.81 |
| nVidia GeForce GTX 760 | 55.93 | 213 | 2.63 |
| nVidia GeForce GTX 670 | 60.30 | 253 | 2.38 |
| nVidia GeForce GTX 580 | 49.35 | 225 | 2.19 |
| AMD Radeon HD 6950 | 35.91 | 165 | 2.18 |
| nVidia GeForce GTX 680 | 66.70 | 307 | 2.17 |
| nVidia GeForce GTX 770 | 69.98 | 333 | 2.10 |
| AMD Radeon HD 7970 | 62.05 | 302 | 2.05 |
| AMD Radeon HD 7970 GHz Edition | 68.30 | 341 | 2.00 |
| MSI GeForce GTX 770 Lightning | 75.87 | 388 | 1.96 |
| AMD Radeon HD 6970 | 40.13 | 261 | 1.54 |
| nVidia GeForce GTX 780 | 79.80 | 547 | 1.46 |
| AMD Radeon HD 6990 | 73.04 | 564 | 1.30 |
| nVidia GeForce GTX TITAN | 85.50 | 832 | 1.03 |
| More is better | Less is better | More is better |
For the price we took the lowest price available on geizhals.eu, on the day the review has been published.
Conclusion
| General | + | - | |
|
MSI’s brand new GeForce GTX 770 Lightning is a really nice piece of
hardware. First thing first: the Lightning is a fast card, performance
wise it is on average 8.5 % faster than the reference GeForce GTX 770 in
the games tested. It is also really cool and does its job silent. MSI's Twin Frozr IV
proved to be better than ASUS' DirectCU II in both cases. In addition,
the card comes well equipped also regarding the power design that has
been beefed up to the edge and the overclocking features which make it
LN2-ready almost out of the box. One word about the bundle, the latter is good with more accessories you usually get with a graphics card. |
- Factory Overclocking
- Performance - Cooling - Power Design - Overclocking features |
||
| Cooling / Noise Level | + | - | |
| That's the first time we get to test with MSI's new
GTX 770 Lightning: the Twin
Frozr IV cooler. We have to say that we have been impressed. GPU Temperatures were
excellent with a maximum of only 63°C
under heavy FurMark load with the fans locked at 30 % fan speed. Now
with the fans in auto, the Lightning did very well too. After
playing BattleField 3 for an hour the maximum temperature hit by the
GPU was 61°C. In this case the maximum fan speed was as low as 44%,
translated it means a noise level of 35 dBA. In comparison the max
values we got with the ASUS GTX 770 DirectCU II OC were 64°C, 76% and
36.2 dBA. In Idle the MSI card was only 2°C warmer than the ambient temperature. |
- inaudible in 2D
- Silent in 3D |
||
| Performance | + | - | |
| The 770 Lightning puts itself right in the middle
of the GTX 780 and the GTX 770 performance wise. In other words, the
Lightning ended up being 8.5% faster than the reference GTX 770 and 7%
slower than the reference GTX 780. Too bad MSI can't release its card
with the memory overclocked out of the box (because of hardware
limitation), we would have liked to see it catching up with the 780. A closer look at power consumption shows, that our test system, equipped with the GTX 770 Lightning, burns 53 Watts under idle conditions and 211 Watts under load. Unfortunately we can't say weather it's very good or very bad since we don't have any card with a reference PCB in our hand but since the Performance/Watt ratio is the second best one we can't say anything bad about. |
- Performance/Watt
- Power consumption under load - Power Consumption in idle |
||
| Recommendation / Price | + | - | |
| With a starting price of 388 Euros excluding shipping costs accross the EU, the Lightning isn't really cheap. That's 55 Euros on top of the cheapest 770 and 25 Euros more expensive than the DirectCU II OC from ASUS for exemple. But considering what you get with the Lightning we think that's a fair price. So if you are looking for a strong GTX 770 you are doing nothing wrong going for the MSI Lightning variant. |
- High-End Gaming
- Extreme Overclocking |
||
| We gave the GTX 770 Lightning from MSI 5 out of 5 stars. | |||
