 With the DirectCU Mini, ASUS has the smallest GeForce GTX 760 on the market to target MiniITX enthusiasts. The concept first introduced with the GeForce GTX 670 Mini seems to have had its success since the manufacturer made a second card of the kind. However, we hope ASUS improved the two major downsides the Mini first of its name had, known as price and noise levels. Let's see!
 Article in English Article in English |
 Artikel in Deutsch Artikel in Deutsch |
 Article en français Article en français |
 Articolo in italiano Articolo in italiano |

On the following pages we will show you the strengths and weaknesses of the ASUS GeForce GTX 760 DirectCU Mini OC.
Technical Data / Specifications
With the ASUS GeForce GTX 760 DirectCU Mini OC you get a factory overclocked card which features a custom PCB as well as a custom cooler. The ASIC quality measured on our sample was 78.3 % which is a bit higher than average but nothing really special.
About ASIC quality:

ASUS' GeForce GTX 760 DirectCU Mini OC is based on NVIDIA's Kepler GK104-225 A2 chip, which is manufactured by TSMC using the latest 28 nanometer process technology. With the GeForce GTX 760 you get six SMX units which results in 1'152 CUDA cores. Following the specs further, there are 96 TMUs, 32 ROPs, a 256 Bit wide memory interface and 2 GB of GDDR5 memory.
Frequency wise, since ASUS didn't bother overclocking the memory, the latter stays clocked at 1'502 MHz (effective 6'008 MHz). On the GPU you find a little factory overclock with a base clock of 1'006 MHz and a typical boost clock of 1'072 MHz. That's shy considering that's only 39 MHz on top of the reference boost clock. However, things get interesting when looking at the actual working frequencies, during our tests the highest boost clock we measured was 1'149 MHz and the average boost clock was also 1'149 MHz.
The card also supports GPU Boost 2.0. The first version of GPU Boost stopped overclocking the GPU when a certain power target was hit. This new second version of GPU Boost stops overclocking the card, when a certain temperature is being reached. This makes sense since the temperature is the bigger inhibitor than the power target in most cases. In this case the temperature target is 80 degrees Celsius. In other words, as long as the GPU runs lower than 80°C it will keep overclocking until the maximum frequency has been reached. This is why in our case the average boost clock was 77 MHz higher than the typical boost clock the manufacturer advertises.

| EVGA SC ACX | ASUS DC Mini OC | ASUS DC2 OC | GeForce GTX 760 | |
| Chip | GK104-225-A2 | GK104-225-A2 | GK104-225-A2 | GK104-225-A2 |
| Process | 28 nm | 28 nm | 28 nm | 28 nm |
| Transistors | 3.54 billion | 3.54 billion | 3.54 billion | 3.54 billion |
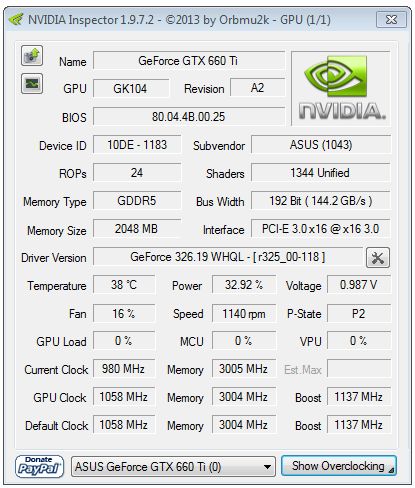
| GPU clock | 1'072 MHz | 1'006 MHz | 1'006 MHz | 980 MHz |
| GPU Boost clock | 1'137 MHz | 1'072 MHz | 1'072 MHz | 1'033 MHz |
| Memory GDDR5 | 2'048 MB | 2'048 MB | 2'048 MB | 2'048 MB |
| Memory clock | 1'502 (6'008) MHz | 1'502 (6'008) MHz | 1'502 (6'008) MHz | 1'502 (6'008) MHz |
| Memory interface | 256 Bit | 256 Bit | 256 Bit | 256 Bit |
| Memory bandwidth | 192'300 MB/s | 192'300 MB/s | 192'300 MB/s | 192'300 MB/s |
| TMUs | 96 | 96 | 96 | 96 |
| Shader Cores | 1'152 (6 SMX) | 1'152 (6 SMX) | 1'152 (6 SMX) | 1'152 (6 SMX) |
| ROPs | 32 | 32 | 32 | 32 |
| TDP | 170 Watt | xxx Watt | xxx Watt | 170 Watt |
| PCB Type | Custom Design | Custom Design | Custom Design | Reference Design |
| Lenght (PCB - Total) | 24.3 - 24.3 cm | 17.5 - 17.5 cm | 17.5 - 21.7 cm | 17.5 - 24.1 cm |
| Height (PCB - Total) | 11.0 - 11.0 cm | 12.1 - 12.1 cm | 12.1 - 12.3 cm | 11.0 - 11.0 cm |
| Slots | 2 | 2 | 2 | 2 |
| Cooler | EVGA ACX | ASUS DirectCU Mini | ASUS DirectCU II | NVIDIA Reference |
| MSRP | $XXX | $XXX | $XXX | $249 |
No surprise here, for its GTX 760 Mini, ASUS makes us of the DirectCU Mini cooler that was first introduced with the GTX 670 Mini. No modifications have been made since the cooling performance were good already on the GTX 670 and the PCB is also the same.
We have to say we like the card much more without the plastic cover like on the picture below. It has some kind of archaic, industrial appeals.

|   
|
A closer look at the PCB shows that ASUS makes use of the exact
same PCB you find on the GTX 760 DirectCU II series and the GTX 670 DC Mini. In
this case you get an analog
five phase power design. The GPU gets its current from four phases and the
memory from one. In comparison, nVidia's reference design
features four plus two phases, which means that the memory gets two and not only
one. Don't worry, ASUS' single phase is stronger than nVidia's two phases.
Checking the
voltage regulation chip we find a RT8867A 4/3 phase analog PWM controller from
Richtek for the GPU. On the memory side we find a single phase APW7165
controller from Anpec.
In comparison, the reference card from nVidia makes use of a NCP5392P from ON Semiconductor
for the GPU and a Richtek 2-phase analog PWM for the memory.
Also, ASUS decided to equip its card with a single 8pin PCIe (150W) power connector
instead of two 6pin PCIe (2x 75W) power connectors like on the reference card.

|   
|
The memory chips used are made by Hynix and carry the model number H5GQ2H24AFR R0C. They are specified to run at 1'500 MHz (6'000 MHz effective).

Preview


Delivery


The card ships well bolstered in a foam made mold. Bundled with the graphics card there is an user guide, a driver CD that includes the overclocking tool too and a power adaptor (2x PCIe-6pin to 1x PCIe-8pin). Apart from that there is nothing else but the card in the box. Overall we would have loved to see like one game in the bundle or at least DVI to VGA adapters. Like it's lying here on the table the bundle is really basic and there is just absolutely nothing special about it.
Test Setup
Hardware
| Mainboard |
|
| CPUs |
|
| Memory |
|
| Graphic Cards (Driver) |
|
| Drivers |
|
| Games and OS |
|
| HDD |
|
| PSU |
|


3DMark - Fire Strike Performance

| Graphics Cards | Score | Graphics Score |
| nVidia GeForce GTX TITAN | 8'296 | 9'298 |
| nVidia GeForce GTX 780 | 7'752 | 8'582 |
| AMD Radeon HD 7970 GHz Edition | 6'979 | 7'733 |
| AMD Radeon HD 6990 | 6'395 | 7'294 |
| nVidia GeForce GTX 770 | 6'581 | 7'293 |
| nVidia GeForce GTX 680 | 6'374 | 7'067 |
| AMD Radeon HD 7970 | 6'474 | 7'052 |
| EVGA GeForce GTX 760 SC ACX | 5'921 | 6'485 |
| ASUS GeForce GTX 760 DC Mini OC | 5'696 | 6'210 |
| nVidia GeForce GTX 670 | 5'567 | 6'046 |
| nVidia GeForce GTX 760 | 5'164 | 5'560 |
| AMD Radeon HD 7870 | 4'947 | 5'339 |
| nVidia GeForce GTX 660 Ti | 4'839 | 5'227 |
| nVidia GeForce GTX 580 | 4'547 | 4'979 |
| nVidia GeForce GTX 660 | 4'353 | 4'637 |
| AMD Radeon HD 7850 | 4'146 | 4'411 |
| nVidia GeForce GTX 650 Ti Boost | 3'708 | 3'904 |
| AMD Radeon HD 6970 | 3'731 | 3'862 |
| AMD Radeon HD 6950 | 3'342 | 3'453 |
| nVidia GeForce GTX 650 Ti | 2'998 | 3'152 |
| AMD Radeon HD 6870 | 2'995 | 3'100 |
| More is better | ||

3DMark - Fire Strike Extreme

| Graphics Cards | Score | Graphics Score |
| nVidia GeForce GTX TITAN | 4'215 | 4'378 |
| nVidia GeForce GTX 780 | 3'931 | 4'054 |
| AMD Radeon HD 7970 GHz Edition | 3'418 | 3'535 |
| nVidia GeForce GTX 770 | 3'275 | 3'419 |
| AMD Radeon HD 6990 | 3'250 | 3'352 |
| nVidia GeForce GTX 680 | 3'160 | 3'292 |
| AMD Radeon HD 7970 | 3'151 | 3'210 |
| EVGA GeForce GTX 760 SC ACX | 2'965 | 3'058 |
| ASUS GeForce GTX 760 DC Mini OC | 2'851 | 2'931 |
| nVidia GeForce GTX 670 | 2'758 | 2'837 |
| nVidia GeForce GTX 760 | 2'556 | 2'609 |
| AMD Radeon HD 7870 | 2'407 | 2'471 |
| nVidia GeForce GTX 660 Ti | 2'342 | 2'412 |
| nVidia GeForce GTX 580 | 2'216 | 2'349 |
| nVidia GeForce GTX 660 | 2'136 | 2'168 |
| AMD Radeon HD 7850 | 2'008 | 2'034 |
| nVidia GeForce GTX 650 Ti Boost | 1'812 | 1'827 |
| AMD Radeon HD 6970 | 1'783 | 1'758 |
| AMD Radeon HD 6950 | 1'586 | 1'556 |
| AMD Radeon HD 6870 | 961 | 927 |
| nVidia GeForce GTX 650 Ti | 9'58 | 910 |
| More is better | ||

Unigine Heaven 4.0 Extreme Preset

| Graphics Cards | Score | fps |
| nVidia GeForce GTX 780 | 1'641 | 65.2 |
| nVidia GeForce GTX TITAN | 1'639 | 65.1 |
| nVidia GeForce GTX 770 | 1'203 | 47.8 |
| AMD Radeon HD 6990 | 1'181 | 46.9 |
| nVidia GeForce GTX 680 | 1'162 | 46.1 |
| AMD Radeon HD 7970 GHz Edition | 1'118 | 44.4 |
| EVGA GeForce GTX 760 SC ACX | 1'098 | 43.7 |
| ASUS GeForce GTX 760 DC Mini OC | 1'063 | 42.2 |
| nVidia GeForce GTX 670 | 1'027 | 40.8 |
| AMD Radeon HD 7970 | 1'018 | 40.4 |
| nVidia GeForce GTX 760 | 951 | 37.7 |
| nVidia GeForce GTX 580 | 914 | 36.3 |
| nVidia GeForce GTX 660 Ti | 867 | 34.4 |
| AMD Radeon HD 7870 | 822 | 32.6 |
| nVidia GeForce GTX 660 | 803 | 31.9 |
| nVidia GeForce GTX 650 Ti Boost | 703 | 27.9 |
| AMD Radeon HD 7850 | 684 | 27.1 |
| AMD Radeon HD 6970 | 610 | 24.2 |
| AMD Radeon HD 6950 | 555 | 22.0 |
| AMD Radeon HD 6870 | 504 | 20.0 |
| nVidia GeForce GTX 650 Ti | 496 | 19.7 |
| More is better | ||
BattleField 3

| High Preset, 1920x1080, 4xMSAA, Ultra, SSAO | Average FPS |
| nVidia GeForce GTX TITAN | 90.6 |
| nVidia GeForce GTX 780 | 86.8 |
| AMD Radeon HD 7970 GHz Edition | 79.2 |
| nVidia GeForce GTX 770 | 75.6 |
| AMD Radeon HD 7970 | 70.8 |
| nVidia GeForce GTX 680 | 70.0 |
| EVGA GeForce GTX 760 SC ACX | 67.8 |
| ASUS GeForce GTX 760 DC Mini OC | 67.4 |
| AMD Radeon HD 6990 | 65.4 |
| nVidia GeForce GTX 670 | 65.4 |
| nVidia GeForce GTX 760 | 61.2 |
| nVidia GeForce GTX 660 Ti | 55.6 |
| AMD Radeon HD 7870 | 53.8 |
| nVidia GeForce GTX 660 | 50.6 |
| nVidia GeForce GTX 580 | 47.8 |
| AMD Radeon HD 7850 | 44.8 |
| nVidia GeForce GTX 650 Ti Boost | 44.0 |
| AMD Radeon HD 6970 | 35.4 |
| nVidia GeForce GTX 650 Ti | 32.2 |
| AMD Radeon HD 6950 | 31.8 |
| AMD Radeon HD 6870 | 29.6 |
| More is better |

Borderlands 2

| High Preset, 1920x1080, FXAA, no PhsyX, High | Average FPS |
| AMD Radeon HD 6990 | 138.8 |
| nVidia GeForce GTX 780 | 138.0 |
| nVidia GeForce GTX TITAN | 135.6 |
| nVidia GeForce GTX 770 | 121.6 |
| nVidia GeForce GTX 680 | 119.2 |
| AMD Radeon HD 7970 GHz Edition | 115.2 |
| EVGA GeForce GTX 760 SC ACX | 115.2 |
| nVidia GeForce GTX 670 | 111.0 |
| ASUS GeForce GTX 760 DC Mini OC | 110.4 |
| AMD Radeon HD 7970 | 105.4 |
| nVidia GeForce GTX 760 | 104.4 |
| nVidia GeForce GTX 660 Ti | 95.0 |
| nVidia GeForce GTX 580 | 91.4 |
| nVidia GeForce GTX 660 | 87.4 |
| nVidia GeForce GTX 650 Ti Boost | 76.6 |
| AMD Radeon HD 7870 | 76.6 |
| AMD Radeon HD 6970 | 74.6 |
| AMD Radeon HD 6950 | 67.0 |
| AMD Radeon HD 7850 | 66.0 |
| AMD Radeon HD 6870 | 58.4 |
| nVidia GeForce GTX 650 Ti | 55.6 |
| More is better |


Bioshock Infinite - Benchmark

| Ultra Preset, 1920x1080, AA, no DDOF | Average FPS |
| nVidia GeForce GTX TITAN | 93.02 |
| nVidia GeForce GTX 780 | 87.24 |
| AMD Radeon HD 6990 | 77.57 |
| AMD Radeon HD 7970 GHz Edition | 76.79 |
| nVidia GeForce GTX 770 | 75.83 |
| nVidia GeForce GTX 680 | 73.67 |
| AMD Radeon HD 7970 | 69.80 |
| EVGA GeForce GTX 760 SC ACX | 68.60 |
| ASUS GeForce GTX 760 DC Mini OC | 66.25 |
| nVidia GeForce GTX 670 | 65.82 |
| nVidia GeForce GTX 760 | 60.84 |
| nVidia GeForce GTX 660 Ti | 58.98 |
| nVidia GeForce GTX 660 | 51.00 |
| nVidia GeForce GTX 580 | 50.74 |
| AMD Radeon HD 7870 | 50.28 |
| nVidia GeForce GTX 650 Ti Boost | 44.44 |
| AMD Radeon HD 7850 | 42.91 |
| AMD Radeon HD 6970 | 42.17 |
| AMD Radeon HD 6950 | 37.23 |
| nVidia GeForce GTX 650 Ti | 34.98 |
| AMD Radeon HD 6870 | 32.61 |
| More is better |

Crysis 3

| High Preset, 1920x1080, 8xMSAA, Very High | Average FPS |
| nVidia GeForce GTX TITAN | 32.8 |
| nVidia GeForce GTX 780 | 31.2 |
| AMD Radeon HD 6990 | 27.2 |
| nVidia GeForce GTX 680 | 25.0 |
| nVidia GeForce GTX 770 | 24.8 |
| nVidia GeForce GTX 670 | 22.8 |
| EVGA GeForce GTX 760 SC ACX | 21.6 |
| ASUS GeForce GTX 760 DC Mini OC | 21.6 |
| nVidia GeForce GTX 760 | 21.2 |
| AMD Radeon HD 7970 GHz Edition | 20.2 |
| nVidia GeForce GTX 660 Ti | 18.8 |
| AMD Radeon HD 7970 | 18.2 |
| nVidia GeForce GTX 660 | 17.4 |
| nVidia GeForce GTX 580 | 17.2 |
| nVidia GeForce GTX 650 Ti Boost | 15.4 |
| AMD Radeon HD 6970 | 14.8 |
| AMD Radeon HD 7870 | 14.4 |
| AMD Radeon HD 6950 | 13.2 |
| AMD Radeon HD 7850 | 11.6 |
| nVidia GeForce GTX 650 Ti | 10.8 |
| AMD Radeon HD 6870 | 9.0 |
| More is better |


Call of Duty Black Ops 2

| High Preset, 1920x1080, 8xMSAA, High | Average FPS |
| AMD Radeon HD 6990 | 115.8 |
| nVidia GeForce GTX TITAN | 114.8 |
| nVidia GeForce GTX 780 | 108.2 |
| nVidia GeForce GTX 770 | 105.8 |
| EVGA GeForce GTX 760 SC ACX | 97.6 |
| ASUS GeForce GTX 760 DC Mini OC | 94.2 |
| nVidia GeForce GTX 680 | 91.8 |
| AMD Radeon HD 7970 GHz Edition | 89.8 |
| AMD Radeon HD 7970 | 82.0 |
| nVidia GeForce GTX 670 | 82.0 |
| nVidia GeForce GTX 760 | 77.6 |
| nVidia GeForce GTX 580 | 69.6 |
| AMD Radeon HD 7870 | 67.8 |
| nVidia GeForce GTX 660 Ti | 67.8 |
| nVidia GeForce GTX 660 | 63.2 |
| AMD Radeon HD 6970 | 60.8 |
| AMD Radeon HD 7850 | 59.4 |
| AMD Radeon HD 6950 | 55.8 |
| nVidia GeForce GTX 650 Ti Boost | 55.8 |
| AMD Radeon HD 6870 | 52.2 |
| nVidia GeForce GTX 650 Ti | 40.4 |
| More is better |

DIRT Showdown - Benchmark

| High Preset, 1920x1080, 8xMSAA, Ultra | Average FPS |
| nVidia GeForce GTX TITAN | 86.32 |
| AMD Radeon HD 7970 GHz Edition | 80.97 |
| nVidia GeForce GTX 780 | 80.17 |
| AMD Radeon HD 6990 | 78.18 |
| AMD Radeon HD 7970 | 74.44 |
| nVidia GeForce GTX 770 | 65.98 |
| nVidia GeForce GTX 680 | 65.27 |
| AMD Radeon HD 7870 | 63.81 |
| EVGA GeForce GTX 760 SC ACX | 61.90 |
| ASUS GeForce GTX 760 DC Mini OC | 59.10 |
| nVidia GeForce GTX 670 | 58.42 |
| nVidia GeForce GTX 760 | 52.89 |
| nVidia GeForce GTX 660 Ti | 52.75 |
| AMD Radeon HD 7850 | 50.99 |
| nVidia GeForce GTX 580 | 48.69 |
| nVidia GeForce GTX 660 | 44.83 |
| AMD Radeon HD 6970 | 44.63 |
| AMD Radeon HD 6950 | 39.21 |
| nVidia GeForce GTX 650 Ti Boost | 37.34 |
| nVidia GeForce GTX 650 Ti | 30.20 |
| AMD Radeon HD 6870 | 30.09 |
| More is better |


Far Cry 3
| High Preset, 1920x1080, 8xMSAA, Ultra | Average FPS |
| nVidia GeForce GTX TITAN | 50.4 |
| nVidia GeForce GTX 780 | 47.2 |
| AMD Radeon HD 6990 | 39.8 |
| nVidia GeForce GTX 770 | 38.0 |
| nVidia GeForce GTX 680 | 36.2 |
| nVidia GeForce GTX 670 | 32.2 |
| EVGA GeForce GTX 760 SC ACX | 32.2 |
| ASUS GeForce GTX 760 DC Mini OC | 31.4 |
| AMD Radeon HD 7970 GHz Edition | 31.0 |
| nVidia GeForce GTX 760 | 29.4 |
| AMD Radeon HD 7970 | 27.8 |
| nVidia GeForce GTX 660 Ti | 27.6 |
| nVidia GeForce GTX 580 | 25.0 |
| nVidia GeForce GTX 660 | 24.6 |
| AMD Radeon HD 7870 | 22.6 |
| AMD Radeon HD 6970 | 20.6 |
| nVidia GeForce GTX 650 Ti Boost | 21.4 |
| AMD Radeon HD 7850 | 18.2 |
| AMD Radeon HD 6950 | 17.8 |
| nVidia GeForce GTX 650 Ti | 15.0 |
| AMD Radeon HD 6870 | 13.4 |
| More is better |

Sleeping Dogs - Benchmark

| High Preset, 1920x1080, Extreme, High-Res Textures | Average FPS |
| nVidia GeForce GTX TITAN | 63.0 |
| nVidia GeForce GTX 780 | 58.6 |
| AMD Radeon HD 6990 | 56.5 |
| AMD Radeon HD 7970 GHz Edition | 51.8 |
| nVidia GeForce GTX 770 | 51.4 |
| nVidia GeForce GTX 680 | 49.0 |
| AMD Radeon HD 7970 | 47.3 |
| EVGA GeForce GTX 760 SC ACX | 43.9 |
| nVidia GeForce GTX 670 | 42.6 |
| ASUS GeForce GTX 760 DC Mini OC | 42.2 |
| nVidia GeForce GTX 760 | 38.9 |
| nVidia GeForce GTX 660 Ti | 38.7 |
| nVidia GeForce GTX 580 | 35.1 |
| AMD Radeon HD 7870 | 33.9 |
| nVidia GeForce GTX 660 | 32.0 |
| AMD Radeon HD 6970 | 29.9 |
| AMD Radeon HD 7850 | 27.6 |
| nVidia GeForce GTX 650 Ti Boost | 26.3 |
| AMD Radeon HD 6950 | 26.0 |
| AMD Radeon HD 6870 | 23.0 |
| nVidia GeForce GTX 650 Ti | 20.1 |
| More is better |

The Elder Scrolls V: Skyrim

| High Preset, 1920x1080, 8xAA, Ultra | Average FPS |
| nVidia GeForce GTX TITAN | 128.0 |
| nVidia GeForce GTX 780 | 122.0 |
| AMD Radeon HD 7970 GHz Edition | 109.8 |
| AMD Radeon HD 6990 | 109.2 |
| nVidia GeForce GTX 770 | 109.0 |
| nVidia GeForce GTX 680 | 105.0 |
| EVGA GeForce GTX 760 SC ACX | 99.4 |
| AMD Radeon HD 7970 | 98.6 |
| ASUS GeForce GTX 760 DC Mini OC | 96.0 |
| nVidia GeForce GTX 670 | 95.6 |
| nVidia GeForce GTX 760 | 88.0 |
| AMD Radeon HD 7870 | 85.6 |
| nVidia GeForce GTX 580 | 84.8 |
| nVidia GeForce GTX 660 Ti | 80.8 |
| nVidia GeForce GTX 660 | 73.4 |
| AMD Radeon HD 7850 | 70.6 |
| AMD Radeon HD 6970 | 64.4 |
| nVidia GeForce GTX 650 Ti Boost | 63.4 |
| AMD Radeon HD 6950 | 58.2 |
| AMD Radeon HD 6870 | 50.0 |
| nVidia GeForce GTX 650 Ti | 47.6 |
| More is better |

Metro: Last Light - Benchmark

| Very High, 1920x1080, SSAA, DX11 | Average FPS |
| nVidia GeForce GTX TITAN | 40.51 |
| nVidia GeForce GTX 780 | 38.78 |
| nVidia GeForce GTX 770 | 32.47 |
| nVidia GeForce GTX 680 | 31.18 |
| EVGA GeForce GTX 760 SC ACX | 28.34 |
| AMD Radeon HD 7970 GHz Edition | 28.28 |
| nVidia GeForce GTX 670 | 27.22 |
| ASUS GeForce GTX 760 DC Mini OC | 27.21 |
| AMD Radeon HD 7970 | 26.18 |
| nVidia GeForce GTX 760 | 24.85 |
| nVidia GeForce GTX 660 Ti | 23.89 |
| nVidia GeForce GTX 580 | 23.18 |
| AMD Radeon HD 6990 | 21.94 |
| nVidia GeForce GTX 660 | 20.79 |
| AMD Radeon HD 7870 | 19.19 |
| nVidia GeForce GTX 650 Ti Boost | 17.80 |
| AMD Radeon HD 7850 | 16.05 |
| AMD Radeon HD 6970 | 14.06 |
| nVidia GeForce GTX 650 Ti | 13.78 |
| AMD Radeon HD 6950 | 12.91 |
| AMD Radeon HD 6870 | 10.99 |
| More is better |

Grand Theft Auto V

Power Consumption

| Power Consumption Idle* | Watts |
| AMD Radeon HD 6990 (Ref) | 75 |
| nVidia GeForce GTX 580 (Ref) | 71 |
| AMD Radeon HD 7850 | 64 |
| AMD Radeon HD 7970 GHz Edition (ASUS Matrix P.) | 62 |
| AMD Radeon HD 6970 (Ref) | 58 |
| AMD Radeon HD 6950 (Ref) | 58 |
| AMD Radeon HD 6870 (Ref) | 57 |
| nVidia GeForce GTX 780 (ASUS DC2OC) | 56 |
| nVidia GeForce GTX 660 Ti (ASUS DC2T) | 55 |
| nVidia GeForce GTX 770 (MSI Lightning) | 53 |
| nVidia GeForce GTX 670 (ASUS DC2T) | 53 |
| nVidia GeForce GTX 660 (ASUS DC2T) | 52 |
| nVidia GeForce GTX 680 (MSI TF - Ref PCB) | 52 |
| AMD Radeon HD 7970 (XFX DP - Ref PCB) | 50 |
| AMD Radeon HD 7870 (ASUS DC2T V2) | 50 |
| nVidia GeForce GTX TITAN (Ref) | 49 |
| nVidia GeForce GTX 650 Ti (ASUS DC2T) | 47 |
| nVidia GeForce GTX 650 Ti Boost (Ref) | 45 |
| nVidia GeForce GTX 760 (ASUS DC2OC) | 45 |
| ASUS GeForce GTX 760 DC Mini OC | 43 |
| EVGA GeForce GTX 760 SC ACX | 40 |
| *Entire system | Less is better |
| Power Consumption Load (FurMark)* | Watts |
| AMD Radeon HD 6990 (Ref) | 358 |
| nVidia GeForce GTX TITAN (Ref) | 285 |
| nVidia GeForce GTX 780 (ASUS DC2OC) | 235 |
| AMD Radeon HD 7970 GHz Edition (ASUS Matrix P.) | 230 |
| AMD Radeon HD 6970 (Ref) | 215 |
| nVidia GeForce GTX 580 (Ref) | 210 |
| AMD Radeon HD 7970 (XFX DP - Ref PCB) | 200 |
| nVidia GeForce GTX 680 (MSI TF - Ref PCB) | 195 |
| ASUS GeForce GTX 760 DC2 OC | 200 |
| ASUS GeForce GTX 760 DC Mini OC | 192 |
| nVidia GeForce GTX 770 (MSI Lightning) | 190 |
| EVGA GeForce GTX 760 SC ACX | 189 |
| AMD Radeon HD 6950 (Ref) | 184 |
| nVidia GeForce GTX 760 (ASUS DC2OC) | 180 |
| nVidia GeForce GTX 670 (ASUS DC2T) | 177 |
| nVidia GeForce GTX 650 Ti Boost (Ref) | 161 |
| AMD Radeon HD 7870 (ASUS DC2T V2) | 149 |
| nVidia GeForce GTX 660 Ti (ASUS DC2T) | 148 |
| nVidia GeForce GTX 660 (ASUS DC2T) | 148 |
| AMD Radeon HD 6870 (Ref) | 145 |
| AMD Radeon HD 7850 | 130 |
| nVidia GeForce GTX 650 Ti (ASUS DC2T) | 120 |
| *Entire system | Less is better |
| Difference Idle/LoadDifférence Idle/Charge | Watts |
| AMD Radeon HD 6990 (Ref) | 283 |
| nVidia GeForce GTX TITAN (Ref) | 236 |
| nVidia GeForce GTX 780 (ASUS DC2OC) | 179 |
| AMD Radeon HD 7970 GHz Edition (ASUS Matrix P.) | 168 |
| AMD Radeon HD 6970 (Ref) | 157 |
| ASUS GeForce GTX 760 DC2 OC | 155 |
| AMD Radeon HD 7970 (XFX DP - Ref PCB) | 150 |
| EVGA GeForce GTX 760 SC ACX | 149 |
| ASUS GeForce GTX 760 DC Mini OC | 149 |
| nVidia GeForce GTX 680 (MSI TF - Ref PCB) | 143 |
| nVidia GeForce GTX 580 (Ref) | 139 |
| nVidia GeForce GTX 770 (MSI Lightning) | 137 |
| nVidia GeForce GTX 760 (ASUS DC2OC) | 133 |
| AMD Radeon HD 6950 (Ref) | 126 |
| nVidia GeForce GTX 670 (ASUS DC2T) | 124 |
| nVidia GeForce GTX 650 Ti Boost (Ref) | 116 |
| AMD Radeon HD 7870 (ASUS DC2T V2) | 99 |
| nVidia GeForce GTX 660 (ASUS DC2T) | 96 |
| nVidia GeForce GTX 660 Ti (ASUS DC2T) | 93 |
| AMD Radeon HD 6870 (Ref) | 88 |
| nVidia GeForce GTX 650 Ti (ASUS DC2T) | 73 |
| AMD Radeon HD 7850 | 66 |
| *Entire system | More is better |

Fan Speed / Noise Level
Fan Speed

Noise Level

For the noise level results, we measured the noise level using a decibel meter (Voltcraft SL-200) located at 1 meter away from the graphics card.
Idle / FurMark / BF3
Idle Temperature

Idle, temperature is taken after 15 minutes @ lowest, 50 %, 70 % and 100 % fan speed.
Room Temperature: 25°C
Temperature under Furmark

For FurMark, temperature is taken after 15 minutes of GPU Burn test at lowest, 50 %, 70 % and 100 % fan speed.
We stopped the test when the GPU temperature hit 90°C.
Room Temperature: 25°C
Temperature and fan speed under BattleField 3

For BattleField 3, temperature and fan speed values taken, are the highest achieved after 1 hour gaming @ auto fan speed.
Performance/Watt
| Graphics Cards | Performance Index | Power C. (Watts)* | Performance/Watt*10 |
| nVidia GeForce GTX 770 (MSI Lightning) | 69.98 | 190 | 3.68 |
| nVidia GeForce GTX 660 Ti (ASUS DC2T) | 51.99 | 148 | 3.51 |
| nVidia GeForce GTX 680 (MSI TF - Ref PCB) | 66.70 | 195 | 3.42 |
| nVidia GeForce GTX 670 (ASUS DC2T) | 60.30 | 177 | 3.41 |
| nVidia GeForce GTX 780 (ASUS DC2OC) | 79.80 | 235 | 3.40 |
| AMD Radeon HD 7870 (ASUS DC2T V2) | 48.80 | 149 | 3.28 |
| EVGA GeForce GTX 760 SC ACX | 63.65 | 189 | 3.26 |
| ASUS GeForce GTX 760 DC Mini OC | 61.58 | 192 | 3.21 |
| AMD Radeon HD 7850 | 40.82 | 130 | 3.14 |
| nVidia GeForce GTX 660 (ASUS DC2T) | 46.52 | 148 | 3.14 |
| nVidia GeForce GTX 760 (ASUS DC2OC) | 55.93 | 180 | 3.11 |
| AMD Radeon HD 7970 (XFX DP - Ref PCB) | 62.05 | 200 | 3.10 |
| ASUS GeForce GTX 760 DC2 OC | 61.58 | 200 | 3.08 |
| AMD Radeon HD 7970 GHz Edition (ASUS Matrix P.) | 68.30 | 230 | 2.97 |
| nVidia GeForce GTX TITAN (Ref) | 85.50 | 285 | 2.93 |
| nVidia GeForce GTX 650 Ti (ASUS DC2T) | 30.06 | 120 | 2.51 |
| nVidia GeForce GTX 650 Ti Boost (Ref) | 40.25 | 161 | 2.50 |
| nVidia GeForce GTX 580 (Ref) | 49.35 | 210 | 2.35 |
| AMD Radeon HD 6870 (Ref) | 30.93 | 145 | 2.13 |
| AMD Radeon HD 6990 (Ref) | 73.04 | 358 | 2.04 |
| AMD Radeon HD 6950 (Ref) | 35.91 | 184 | 1.95 |
| AMD Radeon HD 6970 (Ref) | 40.13 | 215 | 1.87 |
| *Entire system | More is better | Less is better | More is better |
The "Performance Index" value is calculated as the sum of all benchmarks results divided by the amount of games (3DMark and Ungine not included into the calculation).
Performance/Price
| Graphics Cards | Performance Index | Price (€) | Performance/€*10 |
| AMD Radeon HD 7850 | 40.82 | 126 | 3.59 |
| AMD Radeon HD 7870 | 48.80 | 147 | 3.32 |
| nVidia GeForce GTX 660 | 46.52 | 148 | 3.14 |
| nVidia GeForce GTX 650 Ti Boost | 40.25 | 130 | 3.10 |
| nVidia GeForce GTX 650 Ti | 30.06 | 100 | 3.01 |
| nVidia GeForce GTX 660 Ti | 51.99 | 177 | 2.94 |
| EVGA GeForce GTX 760 SC ACX | 63.65 | 219 | 2.91 |
| nVidia GeForce GTX 670 | 60.30 | 253 | 2.86 |
| AMD Radeon HD 6870 | 30.93 | 110 | 2.81 |
| ASUS GeForce GTX 760 DC2 OC | 61.58 | 229 | 2.69 |
| nVidia GeForce GTX 760 | 55.93 | 213 | 2.63 |
| ASUS GeForce GTX 760 DC Mini OC | 61.58 | 238 | 2.59 |
| nVidia GeForce GTX 680 | 66.70 | 285 | 2.34 |
| AMD Radeon HD 7970 GHz Edition | 68.30 | 298 | 2.29 |
| AMD Radeon HD 7970 | 62.05 | 271 | 2.29 |
| nVidia GeForce GTX 770 | 69.98 | 325 | 2.15 |
| AMD Radeon HD 6950 | 35.91 | 169 | 2.12 |
| nVidia GeForce GTX 580 | 49.35 | 248 | 1.99 |
| nVidia GeForce GTX 780 | 79.80 | 499 | 1.60 |
| AMD Radeon HD 6970 | 40.13 | 281 | 1.43 |
| AMD Radeon HD 6990 | 73.04 | 661 | 1.10 |
| nVidia GeForce GTX TITAN | 85.50 | 832 | 1.03 |
| More is better | Less is better | More is better |
For the price we took the lowest price available on geizhals.eu, on the day the review has been published.
Conclusion
| General | + | - | |
| Overall ASUS did a great job with their ultra compact GTX 760 DirectCU
Mini. Even though it's not as complicated to come up with a small form
factor GTX 760 as it was with the GTX 670, ASUS did it and so far they
are the only manufacturer (The Galaxy Mini is longer). The design is
nice and we have to say the card looks even more gorgeous without the
plastic cover and the cooler just plain naked. The small cooler is able to cope with the heat generated by the GK104 GPU but unfortunately to a cost, we have to say that it is a bit noisier than what we're used to from ASUS' DirectCU coolers. |
- Cooling
- Design - Compact form factor |
- Bundle | |
| Cooling / Noise Level | + | - | |
| GPU Temperatures were good with a maximum of 75°C under heavy FurMark load with the fan locked at
lowest fan speed. Unfortubately since the lowest fan speed seems to be
39% on the 760 Mini, used to be 30% on the 670 Mini, the noise levels
are bad, the Mini is as loud in idle as the DirectCU II OC at 70% fan
speed. After one hour gaming the maximum fan speed measured was 56 % and GPU temperature 69°C. Translated it means a maximum noise level of around 40 dBA. So in the end the DirectCU Mini cooler does a really good job for its size but sacrificing silence, it could be much quieter. |
- Cooling performance | - Noise levels | |
| Performance | + | - | |
| Thanks to the factory overclocking and the good cooler, the Mini
OC is on average 9 % faster than the reference card from nVidia in the
tested games. One might think that 9 % difference is a bit high with
only a difference of 39 MHz on the boost clock and you are right but in
our case the Mini was always clocking itself up to 1'149 MHz while the
reference card was clocked at 1'033 MHz on average. A closer look at the power consumption shows good. Mini's power consumption in idle is right inbetween the EVGA card and the DC2OC at the bottom of the table. Under load, while offering the same performance as the DirectCU II OC, the Mini burns 8 Watt less. Since the PCB is the same, we think the explanation lies on the presence of only one fan on the Mini and a higher ASIC quality. |
- Performance/Watt
- Power consumption |
||
| Recommendation / Price | + | - | |
| Price wise, ASUS didn't do the same mistake like with the GTX 670 Mini that was about 80 Euros more expensive than the cheapest 670. Here the 760 Mini costs only 25 Euros more than the cheapest GTX 760 offer and 10 Euros more than the DirectCU II OC. If you should be looking for a graphics card for an ultra compact gaming PC, then this card is perfectly suitable and is also the only one of its kind. But if you are able to fit a longer card then we wouldn't recommend the Mini because of its noises levels. In this case you might want to go for the DirectCU II OC for exemple, same performance, cheaper and much quieter. |
- Gaming
- MiniITX |
- Slient PC | |
| We gave the GeForce GTX 760 DirectCU Mini OC from ASUS 3.5 out of 5 stars. | |||
