MSI Radeon R9 270X HAWK Review
Category : AMD
Published by Christian Ney on 21.10.13
 MSI currently offers two different Radeon R9 270X, the Gaming and the HAWK, and today we are going to have a look at the HAWK. The R9 270X HAWK features the manufacturer's top cooling solution known as Twin Frozr IV Advanced and a beefed up power design/PCB. Other than that the HAWK is the second fastest R9 270X card out of the box.
 Article in English Article in English |
 Artikel in Deutsch Artikel in Deutsch |
 Article en français Article en français |
 Articolo in italiano Articolo in italiano |

On the following pages we will show you the strengths and weaknesses of the MSI Radeon R9 270X HAWK.
Technical Data / Specifications
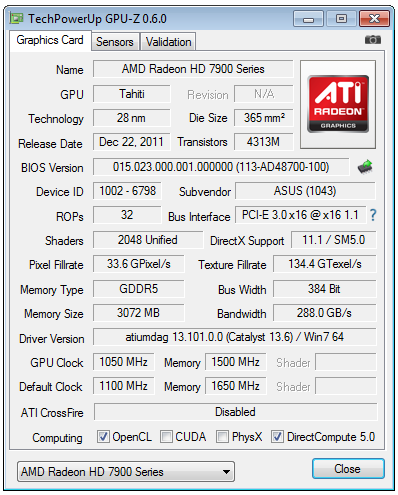
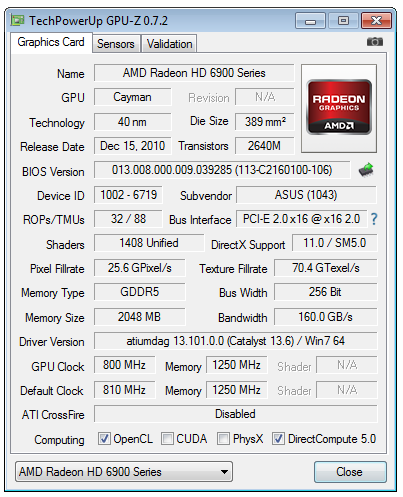
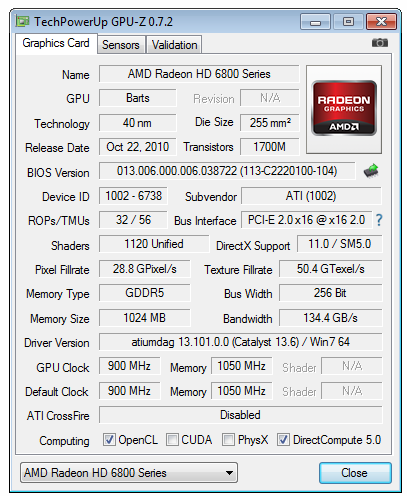
MSI ships its Radeon R9 270X HAWK card with the core clocked at 1'150 MHz and the memory at 1'400 MHz (5'600 effective). Compared to the R9 270X reference clocks the HAWK has a nice factory overclocking with 100 MHz on the core. Unfortunately no factory overclocking was made on the memory. The HAWK is the second fastest Radeon R9 270X out of the box at this time after the Toxic from Sapphire.Although the R9 270X has the PowerTune Boost functionality we never saw it in action. We mean that, the HAWK has actually a core clock of 1'100 MHz and a boost clock of 1'150 MHz. During our testing, the card was always running at full speed of 1'150 MHz under load, we didn't see the chip reduce its clock speed, even under Furmark.
AMD themselves are being obscure on that point too, the reference R9 270X has actually a base clock set at 1'000 MHz with a boost clock of 1'050 MHz but AMD just write down "GPU Clock Speed: Up to 1'050 MHz". The latter is not wrong but it's not exact either.

| MSI HAWK | ASUS DirectCU II Top | Radeon R9 270X | |
| Chip | Pitcairn XTL Curacao XT |
Pitcairn XTL Curacao XT |
Pitcairn XTL Curacao XT |
| Process | 28 nm | 28 nm | 28 nm |
| Transistors | 2.80 billion | 2.80 billion | 2.80 billion |
| GPU clock | 1'150 MHz | 1'120 MHz | 1'050 MHz |
| Memory GDDR5 | 2'048 MB | 2'048 MB | 2'048 MB |
| Memory clock | 1'400 (5'600) MHz | 1'400 (5'600) MHz | 1'400 (5'600) MHz |
| Memory interface | 256 Bit | 256 Bit | 256 Bit |
| Memory bandwidth | 179.2 GB/s | 179.2 GB/s | 179.2 GB/s |
| Shader Cores | 1'280 | 1'280 | 1'280 |
| TMUs | 80 | 80 | 80 |
| ROPs | 32 | 32 | 32 |
| TDP | 161 Watt | xxx Watt | 180 Watt |
| PCB Type | Custom Design | Custom Design | Reference Design |
| Lenght (PCB - Total) | 25.4 - 26.1 cm | 24.3 - 27.3 cm | xx.x - xx.x cm |
| Height (PCB - Total) | 12.1 - 13.0 cm | 11.2 - 13.2 cm | 11.0 - 11.0 cm |
| Slots | 2 | 2 | 2 |
| Cooler | Twin Frozr IV Advanced | DirectCU II | AMD Reference |
| Launch Price | $XXX | $XXX | $199 |
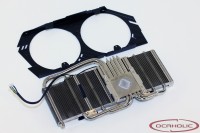
To cool its Radeon R9 270X HAWK MSI makes use of the same Twin Frozr IV cooler you find on the GeForce GTX 760 HAWK. The cooler is exactly the same. In this case you get four six millimeter and one eight millimeter heatpipes. The heatpipes have been nickel-plated and are in contact with the GPU through a copper base plate, which is also nickel-plated. Soldered to the heatpipes you find the fin stack which is being provided with fresh air via two 100mm fans. Both fans are identical and being manufactured by Power Logic. They carry the model number PLD10010B12HH.
Overall the cooler is well made and finished. The thermal paste used is of good quality, soft and hasn't been uselessly spread in large quantity all around the chip. The base doesn't have a perfect mirror finish but is finished well enough.
Most memory chips but one are actively cooled by the metal plate that covers a big part of the PCB. They are in contact with the cooling unit thanks to thermal pads. There is only one memory chip that hasn't been included to the loop
 .
Actually we don't really understand why this is the case. The chip is right next to the
others and we don't see any reason, why it's not been integrated into the
cooling loop.
.
Actually we don't really understand why this is the case. The chip is right next to the
others and we don't see any reason, why it's not been integrated into the
cooling loop.

|   
|
Like all other HAWKs the PCB has been completely reworked and the power design beefed-up. The PCB and the power design are looking similar to what powers the Radeon HD 7870 HAWK, but after a closer look, we spotted a lot of differences. Here we have a ten phase power design where the GPU gets eight (there are five on the reference card) and the memory gets two (there is only one on the ref card) phases. Going further we see, two additional phases for the PCIe and the PLL.
The same metal plate that covers the memory chips is also providing active cooling to the MOSFETs via thermal pads. The manufacturer decided to equip its 270X with a full metal reinforcement (backplate) to prevent bending and it also protects crucial components from potential damage. Otherwise the card features a BIOS for extreme overclockers (LN2 BIOS) that can be selected via DIP switch (located at the top edge of the card). Furthremore virtually everything can be overvolted (GPU, memory and PLL (VDDCI)) via AfterBurner and to monitor what's happening, there are voltage read-out points (GPU, memory and PLL (VDDCI), located at the right edge of the PCB).
Component wise, the HAWK complies with MSI's Military Class 4 Components standard. It doesn't mean you will find military/NASA class components on the PCB, otherwise the card would have been so expensive you couldn't afford it. Still you find high quality components such as New SFC, All Hi-c CAPs for GPU and Dark Solid CAPs.
Checking the voltage regulation chip we find a digital 8-phase controller IR3563B from International Rectifier for the GPU. On the memory side there is a dual phase controller uP1610P from uPI Semiconductor. Lastly there are two single phase controllers labelled GS7252. The one closer to the end of the card takes care of PLL (VDDCI) while the one close to the PCIe connector takes care of the PCIe.

|   
|
The memory chips used are made by Elpida and carry the model number W2032BBBG-6A-F. They are specified to run at 1'500 MHz (6'000 MHz effective).

Preview


Delivery


The card ships well bolstered in a foam made mold. Bundled with the graphics card there is a software CD, an installation manual, three V-Check cables, a DVI to VGA converter and two power adapters (2x Molex to PCIe-6pin).
Test Setup
Hardware
| Mainboard |
|
| CPUs |
|
| Memory |
|
| Graphic Cards (Driver) |
|
| Drivers |
|
| Games and OS |
|
| HDD |
|
| PSU |
|


3DMark - Fire Strike Performance

| Graphics Cards | Score | Graphics Score |
| nVidia GeForce GTX TITAN | 8'396 | 9'420 |
| nVidia GeForce GTX 780 | 7'877 | 8'734 |
| AMD Radeon HD 7970 GHz Edition | 7'091 | 7'922 |
| AMD Radeon R9 280X | 7'093 | 7'837 |
| nVidia GeForce GTX 770 | 6'679 | 7'408 |
| AMD Radeon HD 7970 | 6'578 | 7'215 |
| AMD Radeon HD 6990 | 6'350 | 7'207 |
| nVidia GeForce GTX 680 | 6'402 | 7'102 |
| MSI Radeon R9 270X HAWK | 5'674 | 6'224 |
| nVidia GeForce GTX 670 | 5'624 | 6'099 |
| ASUS Radeon R9 270X DirectCU II Top | 5'521 | 6'039 |
| AMD Radeon R9 270X | 5'318 | 5'784 |
| nVidia GeForce GTX 760 | 5'243 | 5'645 |
| AMD Radeon HD 7870 | 5'009 | 5'436 |
| nVidia GeForce GTX 660 Ti | 4'885 | 5'270 |
| nVidia GeForce GTX 580 | 4'545 | 4'975 |
| nVidia GeForce GTX 660 | 4'415 | 4'707 |
| AMD Radeon HD 7850 | 4'176 | 4'460 |
| nVidia GeForce GTX 650 Ti Boost | 3'762 | 3'962 |
| AMD Radeon HD 6970 | 3'742 | 3'880 |
| AMD Radeon HD 7790 | 3'546 | 3'823 |
| AMD Radeon HD 6950 | 3'338 | 3'446 |
| AMD Radeon HD 5870 | 3'232 | 3'299 |
| nVidia GeForce GTX 650 Ti | 3'031 | 3'182 |
| AMD Radeon HD 6870 | 2'991 | 3'096 |
| AMD Radeon HD 5850 | 2'710 | 2'751 |
| More is better | ||

3DMark - Fire Strike Extreme

| Graphics Cards | Score | Graphics Score |
| nVidia GeForce GTX TITAN | 4'271 | 4'420 |
| nVidia GeForce GTX 780 | 4'007 | 4'121 |
| AMD Radeon HD 7970 GHz Edition | 3'568 | 3'720 |
| AMD Radeon R9 280X | 3'564 | 3'668 |
| nVidia GeForce GTX 770 | 3'319 | 3'448 |
| AMD Radeon HD 6990 | 3'185 | 3'274 |
| AMD Radeon HD 7970 | 3'291 | 3'383 |
| nVidia GeForce GTX 680 | 3'176 | 3'286 |
| MSI Radeon R9 270X HAWK | 2'837 | 2'933 |
| nVidia GeForce GTX 670 | 2'805 | 2'872 |
| ASUS Radeon R9 270X DirectCU II Top | 2'760 | 2'855 |
| AMD Radeon R9 270X | 2'657 | 2'739 |
| nVidia GeForce GTX 760 | 2'610 | 2'655 |
| AMD Radeon HD 7870 | 2'484 | 2'560 |
| nVidia GeForce GTX 660 Ti | 2'378 | 2'440 |
| nVidia GeForce GTX 580 | 2'213 | 2'350 |
| nVidia GeForce GTX 660 | 2'178 | 2'202 |
| AMD Radeon HD 7850 | 2'044 | 2'073 |
| nVidia GeForce GTX 650 Ti Boost | 1'842 | 1'848 |
| AMD Radeon HD 6970 | 1'784 | 1'760 |
| AMD Radeon HD 6950 | 1'585 | 1'555 |
| AMD Radeon HD 7790 | 1'456 | 1'437 |
| AMD Radeon HD 6870 | 1'101 | 1'025 |
| AMD Radeon HD 5870 | 1'005 | 1'005 |
| nVidia GeForce GTX 650 Ti | 942 | 983 |
| AMD Radeon HD 5850 | 959 | 878 |
| More is better | ||

Unigine Heaven 4.0 Extreme Preset

| Graphics Cards | Score | fps |
| nVidia GeForce GTX TITAN | 1'594 | 63.3 |
| nVidia GeForce GTX 780 | 1'537 | 61.0 |
| nVidia GeForce GTX 680 | 1'261 | 50.0 |
| nVidia GeForce GTX 770 | 1'204 | 47.8 |
| AMD Radeon HD 6990 | 1'156 | 45.9 |
| AMD Radeon HD 7970 GHz Edition | 1'137 | 45.1 |
| AMD Radeon R9 280X | 1'113 | 44.2 |
| AMD Radeon HD 7970 | 1'034 | 41.1 |
| nVidia GeForce GTX 670 | 1'028 | 40.8 |
| nVidia GeForce GTX 760 | 951 | 37.8 |
| MSI Radeon R9 270X HAWK | 944 | 37.5 |
| ASUS Radeon R9 270X DirectCU II Top | 921 | 36.5 |
| nVidia GeForce GTX 580 | 915 | 36.3 |
| AMD Radeon R9 270X | 886 | 35.2 |
| nVidia GeForce GTX 660 Ti | 866 | 34.4 |
| AMD Radeon HD 7870 | 826 | 32.8 |
| nVidia GeForce GTX 660 | 801 | 31.8 |
| nVidia GeForce GTX 650 Ti Boost | 705 | 28.0 |
| AMD Radeon HD 7850 | 684 | 27.2 |
| AMD Radeon HD 6970 | 620 | 24.6 |
| AMD Radeon HD 7790 | 568 | 22.5 |
| AMD Radeon HD 6950 | 556 | 22.1 |
| AMD Radeon HD 6870 | 510 | 20.3 |
| nVidia GeForce GTX 650 Ti | 498 | 19.8 |
| AMD Radeon HD 5870 | 478 | 19.0 |
| AMD Radeon HD 5850 | 403 | 16.0 |
| More is better | ||
BattleField 3

| High Preset, 1920x1080, 4xMSAA, Ultra, SSAO | Average FPS |
| nVidia GeForce GTX TITAN | 96.4 |
| nVidia GeForce GTX 780 | 90.4 |
| AMD Radeon HD 7970 GHz Edition | 78.4 |
| AMD Radeon R9 280X | 76.6 |
| nVidia GeForce GTX 770 | 76.6 |
| nVidia GeForce GTX 680 | 72.8 |
| AMD Radeon HD 7970 | 71.2 |
| nVidia GeForce GTX 670 | 66.0 |
| AMD Radeon HD 6990 | 65.6 |
| MSI Radeon R9 270X HAWK | 62.2 |
| nVidia GeForce GTX 760 | 62.0 |
| ASUS Radeon R9 270X DirectCU II Top | 61.0 |
| AMD Radeon R9 270X | 58.2 |
| nVidia GeForce GTX 660 Ti | 55.8 |
| AMD Radeon HD 7870 | 54.2 |
| nVidia GeForce GTX 660 | 50.6 |
| nVidia GeForce GTX 580 | 48.6 |
| AMD Radeon HD 7850 | 44.6 |
| nVidia GeForce GTX 650 Ti Boost | 44.2 |
| AMD Radeon HD 7790 | 36.6 |
| AMD Radeon HD 6970 | 35.8 |
| nVidia GeForce GTX 650 Ti | 33.2 |
| AMD Radeon HD 5870 | 32.6 |
| AMD Radeon HD 6950 | 32.0 |
| AMD Radeon HD 6870 | 29.8 |
| AMD Radeon HD 5850 | 26.6 |
| More is better |

Borderlands 2

| High Preset, 1920x1080, FXAA, no PhsyX, High | Average FPS |
| nVidia GeForce GTX 780 | 131.6 |
| nVidia GeForce GTX TITAN | 128.8 |
| AMD Radeon HD 6990 | 128.6 |
| nVidia GeForce GTX 770 | 118.6 |
| nVidia GeForce GTX 680 | 117.0 |
| AMD Radeon HD 7970 GHz Edition | 115.6 |
| AMD Radeon R9 280X | 112.8 |
| nVidia GeForce GTX 670 | 110.5 |
| AMD Radeon HD 7970 | 105.2 |
| nVidia GeForce GTX 760 | 102.2 |
| nVidia GeForce GTX 660 Ti | 93.8 |
| nVidia GeForce GTX 580 | 89.6 |
| MSI Radeon R9 270X HAWK | 87.2 |
| ASUS Radeon R9 270X DirectCU II Top | 85.8 |
| nVidia GeForce GTX 660 | 85.6 |
| AMD Radeon R9 270X | 82.8 |
| AMD Radeon HD 7870 | 76.6 |
| AMD Radeon HD 6970 | 75.2 |
| nVidia GeForce GTX 650 Ti Boost | 74.8 |
| AMD Radeon HD 6950 | 66.8 |
| AMD Radeon HD 7850 | 66.8 |
| AMD Radeon HD 5870 | 66.4 |
| AMD Radeon HD 6870 | 58.2 |
| AMD Radeon HD 5850 | 55.4 |
| nVidia GeForce GTX 650 Ti | 54.8 |
| AMD Radeon HD 7790 | 54.6 |
| More is better |


Bioshock Infinite - Benchmark

| Ultra Preset, 1920x1080, AA, no DDOF | Average FPS |
| nVidia GeForce GTX TITAN | 95.55 |
| nVidia GeForce GTX 780 | 90.78 |
| nVidia GeForce GTX 770 | 78.98 |
| AMD Radeon HD 6990 | 78.01 |
| AMD Radeon HD 7970 GHz Edition | 76.80 |
| nVidia GeForce GTX 680 | 75.68 |
| AMD Radeon R9 280X | 75.44 |
| AMD Radeon HD 7970 | 70.13 |
| nVidia GeForce GTX 670 | 67.87 |
| nVidia GeForce GTX 760 | 62.41 |
| nVidia GeForce GTX 660 Ti | 60.36 |
| MSI Radeon R9 270X HAWK | 57.47 |
| ASUS Radeon R9 270X DirectCU II Top | 56.53 |
| AMD Radeon R9 270X | 54.79 |
| nVidia GeForce GTX 660 | 52.91 |
| nVidia GeForce GTX 580 | 51.04 |
| AMD Radeon HD 7870 | 50.55 |
| nVidia GeForce GTX 650 Ti Boost | 45.77 |
| AMD Radeon HD 6970 | 43.20 |
| AMD Radeon HD 7850 | 43.13 |
| AMD Radeon HD 5870 | 39.28 |
| AMD Radeon HD 6950 | 38.13 |
| nVidia GeForce GTX 650 Ti | 34.89 |
| AMD Radeon HD 7790 | 34.65 |
| AMD Radeon HD 6870 | 33.69 |
| AMD Radeon HD 5850 | 32.42 |
| More is better |

Crysis 3

| High Preset, 1920x1080, 8xMSAA, Very High | Average FPS |
| nVidia GeForce GTX TITAN | 31.8 |
| nVidia GeForce GTX 780 | 30.2 |
| AMD Radeon HD 6990 | 26.8 |
| nVidia GeForce GTX 770 | 25.8 |
| nVidia GeForce GTX 680 | 24.4 |
| nVidia GeForce GTX 670 | 22.2 |
| nVidia GeForce GTX 760 | 20.4 |
| AMD Radeon HD 7970 GHz Edition | 19.8 |
| AMD Radeon R9 280X | 19.4 |
| nVidia GeForce GTX 660 Ti | 18.8 |
| AMD Radeon HD 7970 | 18.4 |
| nVidia GeForce GTX 580 | 17.0 |
| nVidia GeForce GTX 660 | 16.8 |
| MSI Radeon R9 270X HAWK | 16.0 |
| ASUS Radeon R9 270X DirectCU II Top | 15.4 |
| nVidia GeForce GTX 650 Ti Boost | 15.0 |
| AMD Radeon R9 270X | 15.0 |
| AMD Radeon HD 6970 | 14.6 |
| AMD Radeon HD 7870 | 14.2 |
| AMD Radeon HD 6950 | 12.2 |
| AMD Radeon HD 7850 | 11.8 |
| nVidia GeForce GTX 650 Ti | 10.2 |
| AMD Radeon HD 6870 | 8.4 |
| AMD Radeon HD 7790 | 8.0 |
| AMD Radeon HD 5870 | 8.0 |
| AMD Radeon HD 5850 | 7.6 |
| More is better |


Call of Duty Black Ops 2

| High Preset, 1920x1080, 8xMSAA, High | Average FPS |
| nVidia GeForce GTX TITAN | 130.2 |
| AMD Radeon HD 6990 | 127.0 |
| nVidia GeForce GTX 780 | 121.0 |
| nVidia GeForce GTX 770 | 109.0 |
| nVidia GeForce GTX 680 | 105.4 |
| AMD Radeon HD 7970 GHz Edition | 103.6 |
| AMD Radeon R9 280X | 102.8 |
| nVidia GeForce GTX 670 | 95.8 |
| AMD Radeon HD 7970 | 93.2 |
| MSI Radeon R9 270X HAWK | 89.2 |
| ASUS Radeon R9 270X DirectCU II Top | 88.2 |
| nVidia GeForce GTX 760 | 86.0 |
| AMD Radeon R9 270X | 84.4 |
| nVidia GeForce GTX 580 | 81.8 |
| nVidia GeForce GTX 660 Ti | 81.4 |
| AMD Radeon HD 7870 | 79.2 |
| nVidia GeForce GTX 660 | 72.0 |
| AMD Radeon HD 7850 | 69.0 |
| AMD Radeon HD 6970 | 68.6 |
| AMD Radeon HD 5870 | 64.6 |
| AMD Radeon HD 6950 | 62.4 |
| nVidia GeForce GTX 650 Ti Boost | 62.4 |
| AMD Radeon HD 6870 | 58.4 |
| AMD Radeon HD 5850 | 54.4 |
| nVidia GeForce GTX 650 Ti | 48.2 |
| AMD Radeon HD 7790 | 46.4 |
| More is better |

DIRT Showdown - Benchmark

| High Preset, 1920x1080, 8xMSAA, Ultra | Average FPS |
| nVidia GeForce GTX TITAN | 87.97 |
| nVidia GeForce GTX 780 | 82.36 |
| AMD Radeon HD 6990 | 80.30 |
| AMD Radeon HD 7970 GHz Edition | 79.22 |
| AMD Radeon R9 280X | 76.46 |
| MSI Radeon R9 270X HAWK | 71.73 |
| AMD Radeon HD 7970 | 71.63 |
| ASUS Radeon R9 270X DirectCU II Top | 69.91 |
| nVidia GeForce GTX 770 | 68.79 |
| nVidia GeForce GTX 680 | 67.04 |
| AMD Radeon R9 270X | 64.63 |
| AMD Radeon HD 7870 | 62.53 |
| nVidia GeForce GTX 670 | 58.98 |
| nVidia GeForce GTX 660 Ti | 54.27 |
| nVidia GeForce GTX 760 | 52.48 |
| AMD Radeon HD 7850 | 50.61 |
| nVidia GeForce GTX 580 | 48.92 |
| nVidia GeForce GTX 660 | 45.35 |
| AMD Radeon HD 6970 | 44.19 |
| AMD Radeon HD 7790 | 43.28 |
| AMD Radeon HD 6950 | 38.94 |
| nVidia GeForce GTX 650 Ti Boost | 38.02 |
| AMD Radeon HD 5870 | 36.48 |
| nVidia GeForce GTX 650 Ti | 30.35 |
| AMD Radeon HD 6870 | 30.05 |
| AMD Radeon HD 5850 | 29.13 |
| More is better |


Far Cry 3
| High Preset, 1920x1080, 8xMSAA, Ultra | Average FPS |
| nVidia GeForce GTX TITAN | 50.2 |
| nVidia GeForce GTX 780 | 47.2 |
| AMD Radeon HD 6990 | 39.8 |
| nVidia GeForce GTX 770 | 38.2 |
| nVidia GeForce GTX 680 | 35.6 |
| nVidia GeForce GTX 670 | 32.2 |
| AMD Radeon HD 7970 GHz Edition | 31.0 |
| AMD Radeon R9 280X | 30.0 |
| nVidia GeForce GTX 760 | 29.4 |
| AMD Radeon HD 7970 | 27.8 |
| nVidia GeForce GTX 660 Ti | 27.0 |
| MSI Radeon R9 270X HAWK | 25.4 |
| nVidia GeForce GTX 580 | 24.8 |
| ASUS Radeon R9 270X DirectCU II Top | 24.8 |
| nVidia GeForce GTX 660 | 24.6 |
| AMD Radeon R9 270X | 23.8 |
| AMD Radeon HD 7870 | 22.4 |
| nVidia GeForce GTX 650 Ti Boost | 21.2 |
| AMD Radeon HD 6970 | 20.6 |
| AMD Radeon HD 6950 | 18.0 |
| AMD Radeon HD 7850 | 17.8 |
| nVidia GeForce GTX 650 Ti | 15.4 |
| AMD Radeon HD 5870 | 15.2 |
| AMD Radeon HD 6870 | 13.0 |
| AMD Radeon HD 5850 | 13.0 |
| AMD Radeon HD 7790 | 10.6 |
| More is better |

Sleeping Dogs - Benchmark

| High Preset, 1920x1080, Extreme, High-Res Textures | Average FPS |
| nVidia GeForce GTX TITAN | 62.4 |
| nVidia GeForce GTX 780 | 58.7 |
| AMD Radeon HD 6990 | 56.6 |
| AMD Radeon HD 7970 GHz Edition | 51.7 |
| nVidia GeForce GTX 770 | 51.7 |
| AMD Radeon R9 280X | 50.7 |
| nVidia GeForce GTX 680 | 48.7 |
| AMD Radeon HD 7970 | 47.0 |
| nVidia GeForce GTX 670 | 42.7 |
| nVidia GeForce GTX 760 | 38.7 |
| nVidia GeForce GTX 660 Ti | 38.7 |
| MSI Radeon R9 270X HAWK | 38.5 |
| ASUS Radeon R9 270X DirectCU II Top | 37.7 |
| AMD Radeon R9 270X | 36.4 |
| nVidia GeForce GTX 580 | 35.1 |
| AMD Radeon HD 7870 | 33.8 |
| nVidia GeForce GTX 660 | 32.0 |
| AMD Radeon HD 6970 | 30.0 |
| AMD Radeon HD 7850 | 27.6 |
| AMD Radeon HD 5870 | 27.3 |
| nVidia GeForce GTX 650 Ti Boost | 26.3 |
| AMD Radeon HD 6950 | 26.2 |
| AMD Radeon HD 6870 | 22.9 |
| AMD Radeon HD 7790 | 22.2 |
| AMD Radeon HD 5850 | 22.2 |
| nVidia GeForce GTX 650 Ti | 19.9 |
| More is better |

The Elder Scrolls V: Skyrim

| High Preset, 1920x1080, 8xAA, Ultra | Average FPS |
| nVidia GeForce GTX TITAN | 127.2 |
| nVidia GeForce GTX 780 | 126.2 |
| AMD Radeon HD 7970 GHz Edition | 110.4 |
| AMD Radeon HD 6990 | 109.2 |
| nVidia GeForce GTX 770 | 109.0 |
| nVidia GeForce GTX 680 | 106.4 |
| AMD Radeon R9 280X | 106.0 |
| AMD Radeon HD 7970 | 98.6 |
| MSI Radeon R9 270X HAWK | 96.8 |
| nVidia GeForce GTX 670 | 96.4 |
| ASUS Radeon R9 270X DirectCU II Top | 94.6 |
| AMD Radeon R9 270X | 90.4 |
| nVidia GeForce GTX 760 | 87.6 |
| AMD Radeon HD 7870 | 85.2 |
| nVidia GeForce GTX 580 | 84.8 |
| nVidia GeForce GTX 660 Ti | 81.4 |
| nVidia GeForce GTX 660 | 73.0 |
| AMD Radeon HD 7850 | 71.0 |
| AMD Radeon HD 6970 | 64.0 |
| nVidia GeForce GTX 650 Ti Boost | 63.2 |
| AMD Radeon HD 6950 | 58.4 |
| AMD Radeon HD 5870 | 56.6 |
| AMD Radeon HD 7790 | 56.2 |
| AMD Radeon HD 6870 | 52.0 |
| AMD Radeon HD 5850 | 48.6 |
| nVidia GeForce GTX 650 Ti | 47.2 |
| More is better |

Metro: Last Light - Benchmark

| Very High, 1920x1080, SSAA, DX11 | Average FPS |
| nVidia GeForce GTX TITAN | 39.94 |
| nVidia GeForce GTX 780 | 38.18 |
| AMD Radeon R9 280X | 33.78 |
| AMD Radeon HD 7970 GHz Edition | 33.41 |
| nVidia GeForce GTX 770 | 32.53 |
| AMD Radeon HD 7970 | 30.98 |
| nVidia GeForce GTX 680 | 30.56 |
| AMD Radeon HD 6990 | 27.65 |
| nVidia GeForce GTX 670 | 27.30 |
| nVidia GeForce GTX 760 | 25.09 |
| MSI Radeon R9 270X HAWK | 24.96 |
| ASUS Radeon R9 270X DirectCU II Top | 24.18 |
| nVidia GeForce GTX 660 Ti | 23.97 |
| AMD Radeon R9 270X | 23.46 |
| nVidia GeForce GTX 580 | 23.25 |
| AMD Radeon HD 7870 | 21.58 |
| nVidia GeForce GTX 660 | 20.84 |
| AMD Radeon HD 7850 | 18.09 |
| nVidia GeForce GTX 650 Ti Boost | 17.83 |
| AMD Radeon HD 6970 | 17.05 |
| AMD Radeon HD 6950 | 15.22 |
| AMD Radeon HD 7790 | 14.94 |
| nVidia GeForce GTX 650 Ti | 13.83 |
| AMD Radeon HD 5870 | 13.33 |
| AMD Radeon HD 6870 | 12.37 |
| AMD Radeon HD 5850 | 11.11 |
| More is better |

Grand Theft Auto V

Power Consumption

| Power Consumption Idle* | Watts |
| AMD Radeon HD 6990 (Ref) | 80 |
| nVidia GeForce GTX 580 (Ref) | 69 |
| AMD Radeon HD 7970 GHz Edition (ASUS Matrix P.) | 60 |
| AMD Radeon HD 6970 (Ref) | 57 |
| AMD Radeon HD 6950 (Ref) | 57 |
| AMD Radeon HD 5850 (Ref) | 56 |
| AMD Radeon HD 6870 (Ref) | 54 |
| nVidia GeForce GTX 780 (ASUS DC2OC) | 54 |
| nVidia GeForce GTX 660 Ti (ASUS DC2T) | 54 |
| AMD Radeon HD 5870 (Ref) | 53 |
| nVidia GeForce GTX 770 (ASUS DC2OC) | 53 |
| nVidia GeForce GTX 670 (ASUS DC2T) | 52 |
| nVidia GeForce GTX 680 (Ref) | 51 |
| nVidia GeForce GTX 660 (ASUS DC2T) | 50 |
| AMD Radeon HD 7870 (ASUS DC2T V2) | 48 |
| AMD Radeon R9 280X (ASUS DC2T) | 48 |
| AMD Radeon R9 270X (ASUS DC2T) | 48 |
| ASUS Radeon R9 270X DirectCU II Top | 48 |
| AMD Radeon HD 7970 (XFX DD - Ref PCB) | 47 |
| nVidia GeForce GTX TITAN (Ref) | 47 |
| MSI Radeon R9 270X HAWK | 45 |
| nVidia GeForce GTX 650 Ti (ASUS DC2T) | 45 |
| AMD Radeon HD 7850 (ASUS DC2T) | 45 |
| AMD Radeon HD 7790 (ASUS DC2OC - Ref PCB) | 45 |
| nVidia GeForce GTX 760 (ASUS DC2OC) | 45 |
| nVidia GeForce GTX 650 Ti Boost (Ref) | 43 |
| *Entire system | Less is better |
| Power Consumption Load (FurMark)* | Watts |
| AMD Radeon HD 6990 (Ref) | 481 |
| AMD Radeon HD 7970 GHz Edition (ASUS Matrix P.) | 360 |
| AMD Radeon HD 7970 (XFX DD - Ref PCB) | 323 |
| AMD Radeon R9 280X (ASUS DC2T) | 320 |
| nVidia GeForce GTX TITAN (Ref) | 306 |
| nVidia GeForce GTX 780 (ASUS DC2OC) | 302 |
| nVidia GeForce GTX 680 (Ref) | 258 |
| nVidia GeForce GTX 770 (ASUS DC2OC) | 257 |
| MSI Radeon R9 270X HAWK | 257 |
| ASUS Radeon R9 270X DirectCU II Top | 247 |
| nVidia GeForce GTX 580 (Ref) | 254 |
| AMD Radeon HD 6970 (Ref) | 244 |
| AMD Radeon HD 5870 (Ref) | 232 |
| nVidia GeForce GTX 670 (ASUS DC2T) | 227 |
| AMD Radeon R9 270X (ASUS DC2T) | 223 |
| AMD Radeon HD 7870 (ASUS DC2T V2) | 220 |
| nVidia GeForce GTX 760 (ASUS DC2OC) | 218 |
| AMD Radeon HD 6950 (Ref) | 208 |
| AMD Radeon HD 6870 (Ref) | 200 |
| AMD Radeon HD 7850 (ASUS DC2T) | 195 |
| AMD Radeon HD 5850 (Ref) | 193 |
| nVidia GeForce GTX 660 Ti (ASUS DC2T) | 178 |
| nVidia GeForce GTX 660 (ASUS DC2T) | 177 |
| nVidia GeForce GTX 650 Ti Boost (Ref) | 169 |
| AMD Radeon HD 7790 (ASUS DC2OC - Ref PCB) | 152 |
| nVidia GeForce GTX 650 Ti (ASUS DC2T) | 151 |
| *Entire system | Less is better |
| Difference Idle/LoadDifférence Idle/Charge | Watts |
| AMD Radeon HD 6990 (Ref) | 401 |
| AMD Radeon HD 7970 GHz Edition (ASUS Matrix P.) | 300 |
| AMD Radeon HD 7970 (XFX DD - Ref PCB) | 276 |
| AMD Radeon R9 280X (ASUS DC2T) | 272 |
| nVidia GeForce GTX TITAN (Ref) | 259 |
| nVidia GeForce GTX 780 (ASUS DC2OC) | 248 |
| MSI Radeon R9 270X HAWK | 212 |
| nVidia GeForce GTX 680 (Ref) | 207 |
| nVidia GeForce GTX 770 (ASUS DC2OC) | 204 |
| ASUS Radeon R9 270X DirectCU II Top | 199 |
| AMD Radeon HD 6970 (Ref) | 187 |
| nVidia GeForce GTX 580 (Ref) | 185 |
| AMD Radeon HD 5870 (Ref) | 179 |
| AMD Radeon R9 270X (ASUS DC2T) | 175 |
| nVidia GeForce GTX 670 (ASUS DC2T) | 175 |
| nVidia GeForce GTX 760 (ASUS DC2OC) | 173 |
| AMD Radeon HD 7870 (ASUS DC2T V2) | 172 |
| AMD Radeon HD 6950 (Ref) | 151 |
| AMD Radeon HD 7850 (ASUS DC2T) | 150 |
| AMD Radeon HD 6870 (Ref) | 146 |
| AMD Radeon HD 5850 (Ref) | 137 |
| nVidia GeForce GTX 660 (ASUS DC2T) | 127 |
| nVidia GeForce GTX 650 Ti Boost (Ref) | 126 |
| nVidia GeForce GTX 660 Ti (ASUS DC2T) | 124 |
| AMD Radeon HD 7790 (ASUS DC2OC - Ref PCB) | 107 |
| nVidia GeForce GTX 650 Ti (ASUS DC2T) | 106 |
| *Entire system | More is better |

Fan Speed / Noise Level
Fan Speed

Noise Level

For the noise level results, we measured the noise level using a decibel meter (Voltcraft SL-200) located at 1 meter away from the graphics card.
Idle / FurMark / BF3
Idle Temperature

Idle, temperature is taken after 15 minutes @ lowest, 40 %, 50 %, 70 % and 100 % fan speed.
Room Temperature: 25°C
Temperature under Furmark

For FurMark, temperature is taken after 15 minutes of GPU Burn test at lowest, 40 %, 50 %, 70 % and 100 % fan speed.
We stopped the test when the GPU temperature hit 90°C.
Room Temperature: 25°C
Temperature and fan speed under BattleField 3

For BattleField 3, temperature and fan speed values taken, are the highest achieved after 1 hour gaming @ auto fan speed.
Performance/Watt
| Graphics Cards | Performance Index | Power C. (Watts)* | Performance/Watt*10 |
| nVidia GeForce GTX 660 Ti (ASUS DC2T) | 53.55 | 178 | 3.01 |
| nVidia GeForce GTX TITAN (Ref) | 85.05 | 306 | 2.78 |
| nVidia GeForce GTX 770 (ASUS DC2OC) | 70.92 | 257 | 2.76 |
| nVidia GeForce GTX 670 (ASUS DC2T) | 62.00 | 227 | 2.73 |
| nVidia GeForce GTX 780 (ASUS DC2OC) | 81.66 | 302 | 2.70 |
| nVidia GeForce GTX 660 (ASUS DC2T) | 47.37 | 177 | 2.68 |
| nVidia GeForce GTX 680 (Ref) | 68.36 | 258 | 2.65 |
| nVidia GeForce GTX 760 (ASUS DC2OC) | 56.63 | 218 | 2.60 |
| nVidia GeForce GTX 650 Ti Boost (Ref) | 40.87 | 169 | 2.42 |
| AMD Radeon R9 270X (ASUS DC2T) | 53.39 | 223 | 2.39 |
| AMD Radeon HD 7870 (ASUS DC2T V2) | 50.03 | 220 | 2.27 |
| ASUS Radeon R9 270X DirectCU II Top | 55.81 | 247 | 2.26 |
| MSI Radeon R9 270X HAWK | 56.95 | 257 | 2.22 |
| AMD Radeon HD 7850 (ASUS DC2T) | 42.04 | 195 | 2.16 |
| AMD Radeon HD 7790 (ASUS DC2OC - Ref PCB) | 32.75 | 152 | 2.15 |
| AMD Radeon R9 280X (ASUS DC2T) | 68.40 | 320 | 2.14 |
| nVidia GeForce GTX 650 Ti (ASUS DC2T) | 30.8 | 151 | 2.04 |
| nVidia GeForce GTX 580 (Ref) | 50.49 | 254 | 1.99 |
| AMD Radeon HD 7970 (XFX DD - Ref PCB) | 63.41 | 323 | 1.96 |
| AMD Radeon HD 7970 GHz Edition (ASUS Matrix P.) | 69.99 | 360 | 1.94 |
| AMD Radeon HD 6950 (Ref) | 36.83 | 208 | 1.77 |
| AMD Radeon HD 6970 (Ref) | 41.32 | 244 | 1.69 |
| AMD Radeon HD 6870 (Ref) | 31.88 | 200 | 1.59 |
| AMD Radeon HD 5850 (Ref) | 30.05 | 193 | 1.56 |
| AMD Radeon HD 5870 (Ref) | 35.98 | 232 | 1.55 |
| AMD Radeon HD 6990 (Ref) | 73.96 | 481 | 1.54 |
| *Entire system | More is better | Less is better | More is better |
The "Performance Index" value is calculated as the sum of all benchmarks results divided by the amount of games (3DMark and Ungine not included into the calculation).
Performance/Price
| Graphics Cards | Performance Index | Price (€)* | Performance/€*10 |
| nVidia GeForce GTX 650 Ti Boost | 40.87 | 110 | 3.72 |
| nVidia GeForce GTX 660 | 47.37 | 137 | 3.46 |
| AMD Radeon HD 7870 | 50.03 | 145 | 3.45 |
| AMD Radeon HD 7790 | 32.75 | 97 | 3.38 |
| AMD Radeon HD 7850 | 40.04 | 121 | 3.31 |
| AMD Radeon R9 270X | 53.39 | 165 | 3.24 |
| nVidia GeForce GTX 660 Ti | 53.55 | 177 | 3.03 |
| nVidia GeForce GTX 650 Ti | 30.80 | 102 | 3.02 |
| MSI Radeon R9 270X HAWK | 56.95 | 191 | 2.98 |
| nVidia GeForce GTX 760 | 56.63 | 192 | 2.95 |
| ASUS Radeon R9 270X DirectCU II Top | 55.81 | 191 | 2.92 |
| AMD Radeon HD 6870 | 31.88 | 111 | 2.87 |
| AMD Radeon R9 280X | 68.40 | 245 | 2.79 |
| AMD Radeon HD 7970 GHz Edition | 69.99 | 260 | 2.69 |
| AMD Radeon HD 7970 | 63.41 | 236 | 2.69 |
| nVidia GeForce GTX 680 | 68.36 | 283 | 2.42 |
| nVidia GeForce GTX 580 | 50.49 | 215 | 2.35 |
| nVidia GeForce GTX 770 | 70.92 | 319 | 2.22 |
| nVidia GeForce GTX 670 | 62.00 | 320 | 1.94 |
| AMD Radeon HD 6950 | 36.83 | 204 | 1.81 |
| nVidia GeForce GTX 780 | 81.66 | 511 | 1.60 |
| AMD Radeon HD 6970 | 41.32 | 281 | 1.47 |
| AMD Radeon HD 5870 | 35.98 | 246 | 1.46 |
| AMD Radeon HD 5850 | 30.05 | 221 | 1.36 |
| AMD Radeon HD 6990 | 73.96 | 656 | 1.13 |
| nVidia GeForce GTX TITAN | 85.05 | 800 | 1.06 |
| * 18/10/2013 | More is better | Less is better | More is better |
For the price we took the lowest price available on geizhals.eu.
Conclusion

| General | + | - | |
| The Radeon R9 270X HAWK from MSI is a
really nice piece of hardware. It features a very strong power design, a
great cooling solution
and some nice overclocking features. But the card isn't perfect, since it comes
with a very high price tag and MSI could have easily pushed the factory overclocking
further. 100 MHz on the core is good but equipping the card with memory chips
rated at 1'500 MHz but actually clocking them at 1'400 MHz makes us cry. Also we have to point out that the Radeon 200 series is not currently part of the Never Settle Forever program. This may change in the future but at the moment you don't get any game for free buying a Radeon 200 series card unless the manufacturer specifies otherwise. |
- Performance
- Cooling - Design - Power Design - GPU Clock - Overclocking features |
- Price
- Memory Clock |
|
| Cooling / Noise Level | + | - | |
| For its Radeon R9 270X HAWK MSI makes use of the same cooler you can find on the GeForce GTX 770 Lightning and 760 HAWK. This Twin Frozr IV Advanced is powerful, the cooling performance is great, the build quality is very good and it is extremely silent under load conditions, almost noiseless. In idle it is. | - Cooling performance
- Noise levels |
||
| Performance | + | - | |
| The Radeon R9 270X HAWK is a fast card.
In the games tested it is on average 6.7 % faster than a
Radeon R9 270X with reference clocks , 14 % faster than a reference clocked
Radeon HD 7870 and as fast as a GeForce GTX 760. A closer look at power consumption shows, that our test system, equipped with the HAWK, burns 45 Watts under idle conditions and 257 Watts under load. In idle that's a very good result but under load we think the power consumption is a bit high compared to stock clocked R9 270X and HD 7870. The HAWK draws as much as a reference GTX 680 for example and there is a 20% performance gap between the two cards. |
- Performance | - Performance/Watt
- Power consumption under load |
|
| Recommendation / Price | + | - | |
| The Radeon R9 270X prices are much better than last
week. At the time of the review, the HAWK can be found with a starting
price of 191 Euro and the cheapest offer for a R9 270X starts at 165
Euros excluding shipping costs accross the EU. Its price is good and bad at the same time. On one side the HAWK costs as much as the DirectCU II Top, for example, is faster, better and more silent. It also costs as much as the cheapest GTX 760 that offers same performance. On the other side we think 26 Euro is a bit too much on top even for what you get. Furthermore the Rx 200 series is not currently part of the Never Settle Forever program. The graphics card itself is a beast but unfortunately manufacturers can't do magic with a two years old chip. Especially when its new release doesn't come with the game bundle the old release still comes with. All things considered, we would recommend R9 270X HAWK, or any other R9 270X for that matter, only if you are not interested in the game bundle. If you are interested in the game bundle, you're better off with a custom Radeon HD 7950 that comes with it, offers better or same performance and is cheaper or as expensive. |
- Gaming
- Overclocking |
- Price | |
| We gave the Radeon R9 270X HAWK from MSI 4.5 out of 5 stars. | |||