GeForce GTX 670 vs GTX 770 - Should I upgrade?
Category : Should I Upgrade?
Published by Marc Büchel on 11.12.13
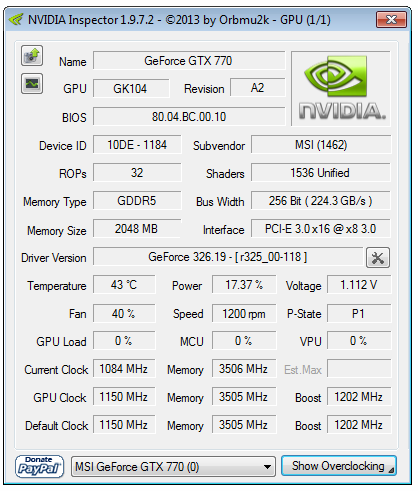
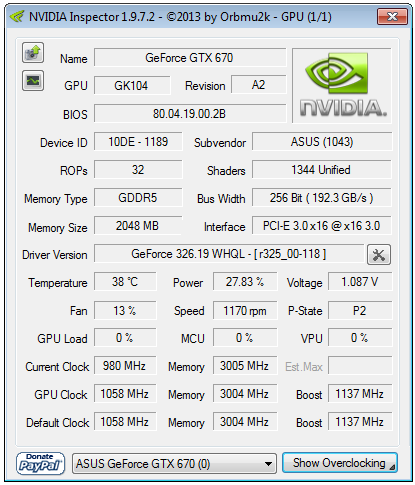
A gamer simply can't get enough graphics power in their rig, which makes the upgrade question omnipresent. To show you whether it makes sense to upgrade from one generation to another we created this series of articles, where we will compare graphics cards from different generations. Today we're having a close look at the differences between the GTX 670 and the GTX 770.


  Article in English   Artikel in Deutsch   Article en français   Articolo in italiano


Page 1 - Introduction Page 10 - DIRT Showdown
Page 2 - Test Setup Page 11 - Far Cry 3
Page 3 - 3DMark Fire Strike Page 12 - Sleeping Dogs
Page 4 - Unigine Heaven 4.0 Page 13 - The Elder Scrolls V: Skyrim
Page 5 - BattleField 3 Page 14 - Metro: Last Light
Page 6 - Borderlands 2 Page 15 - GTA V
Page 7 - Bioshock Infinite Page 16 - Power Consumption
Page 8 - Crysis 3 Page 17 - Performance Index, price
Page 9 - Call of Duty Black Ops 2 Page 18 - Conclusion
[pagebreak]

Test Setup

Hardware

Mainboard
  • ASUS Maximus V Gene (BIOS 1802)
CPUs
  • Intel Core i7-3770K @ 4.0 GHz (Turbo On / HT On)
Memory
  • G.Skill Ares Dual Channel 2x8GB @ CL11-13-13-31-1T-Auto DDR3-2400 MHz
Graphic Cards (Driver)
  • nVidia GeForce GTX 770
  • nVidia GeForce GTX 670
Drivers
  • Windows 7 x64 (up to date)
  • NVIDIA ForceWare 331.40 Beta
  • AMD Catalyst 13.11 BetaV1
  • Intel Chipset Driver 9.4.0.1026
Games and OS
  • Windows 7 x64 (Up to date on the ) 01/10/2013
  • All games were up to date on the 01/10/2013
HDD
  • OCZ Technology Octane 512 GB SSD
PSU
  • Seasonic Platinum SS-1000XP / 1000 Watts


Page 1 - Introduction Page 10 - DIRT Showdown
Page 2 - Test Setup Page 11 - Far Cry 3
Page 3 - 3DMark Fire Strike Page 12 - Sleeping Dogs
Page 4 - Unigine Heaven 4.0 Page 13 - The Elder Scrolls V: Skyrim
Page 5 - BattleField 3 Page 14 - Metro: Last Light
Page 6 - Borderlands 2 Page 15 - GTA V
Page 7 - Bioshock Infinite Page 16 - Power Consumption
Page 8 - Crysis 3 Page 17 - Performance Index, price
Page 9 - Call of Duty Black Ops 2 Page 18 - Conclusion
[pagebreak]

3DMark - Fire Strike Performance


Total Score Score Index
nVidia GeForce GTX 770 6'679 118.76 %
nVidia GeForce GTX 670 5'624 100.00 %
     
Graphics Score Score Index
nVidia GeForce GTX 770 7'408 121.46 %
nVidia GeForce GTX 670 6'099 100.00 %
More is better


3DMark - Fire Strike Extreme


Total Score Score Index
nVidia GeForce GTX 770 3'319 118.32 %
nVidia GeForce GTX 670 2'805 100.00 %
     
Graphics Score Score Index
nVidia GeForce GTX 770 3'448 120.06 %
nVidia GeForce GTX 670 2'872 100.00 %
More is better


Page 1 - Introduction Page 10 - DIRT Showdown
Page 2 - Test Setup Page 11 - Far Cry 3
Page 3 - 3DMark Fire Strike Page 12 - Sleeping Dogs
Page 4 - Unigine Heaven 4.0 Page 13 - The Elder Scrolls V: Skyrim
Page 5 - BattleField 3 Page 14 - Metro: Last Light
Page 6 - Borderlands 2 Page 15 - GTA V
Page 7 - Bioshock Infinite Page 16 - Power Consumption
Page 8 - Crysis 3 Page 17 - Performance Index, price
Page 9 - Call of Duty Black Ops 2 Page 18 - Conclusion
[pagebreak]

Unigine Heaven 4.0 Extreme Preset


Total Score Score Index
nVidia GeForce GTX 770 1'204 117.12 %
nVidia GeForce GTX 670 1'028 100.00 %
     
Frames per second FPS Index
nVidia GeForce GTX 770 47.8 117.16 %
nVidia GeForce GTX 670 40.8 100.00 %
More is better


Page 1 - Introduction Page 10 - DIRT Showdown
Page 2 - Test Setup Page 11 - Far Cry 3
Page 3 - 3DMark Fire Strike Page 12 - Sleeping Dogs
Page 4 - Unigine Heaven 4.0 Page 13 - The Elder Scrolls V: Skyrim
Page 5 - BattleField 3 Page 14 - Metro: Last Light
Page 6 - Borderlands 2 Page 15 - GTA V
Page 7 - Bioshock Infinite Page 16 - Power Consumption
Page 8 - Crysis 3 Page 17 - Performance Index, price
Page 9 - Call of Duty Black Ops 2 Page 18 - Conclusion
[pagebreak]

BattleField 3


High Preset, 1920x1080, 4xMSAA, Ultra, SSAO FPS Index
nVidia GeForce GTX 770 76.6 116.06 %
nVidia GeForce GTX 670 66.0 100.00 %
More is better


Page 1 - Introduction Page 10 - DIRT Showdown
Page 2 - Test Setup Page 11 - Far Cry 3
Page 3 - 3DMark Fire Strike Page 12 - Sleeping Dogs
Page 4 - Unigine Heaven 4.0 Page 13 - The Elder Scrolls V: Skyrim
Page 5 - BattleField 3 Page 14 - Metro: Last Light
Page 6 - Borderlands 2 Page 15 - GTA V
Page 7 - Bioshock Infinite Page 16 - Power Consumption
Page 8 - Crysis 3 Page 17 - Performance Index, price
Page 9 - Call of Duty Black Ops 2 Page 18 - Conclusion
[pagebreak]

Borderlands 2


High Preset, 1920x1080, FXAA, no PhsyX, High FPS Index
nVidia GeForce GTX 770 118.6 107.33 %
nVidia GeForce GTX 670 110.5 100.00 %
More is better


Page 1 - Introduction Page 10 - DIRT Showdown
Page 2 - Test Setup Page 11 - Far Cry 3
Page 3 - 3DMark Fire Strike Page 12 - Sleeping Dogs
Page 4 - Unigine Heaven 4.0 Page 13 - The Elder Scrolls V: Skyrim
Page 5 - BattleField 3 Page 14 - Metro: Last Light
Page 6 - Borderlands 2 Page 15 - GTA V
Page 7 - Bioshock Infinite Page 16 - Power Consumption
Page 8 - Crysis 3 Page 17 - Performance Index, price
Page 9 - Call of Duty Black Ops 2 Page 18 - Conclusion
[pagebreak]

Bioshock Infinite - Benchmark


Ultra Preset, 1920x1080, AA, no DDOF FPS Index
nVidia GeForce GTX 770 78.98 116.37 %
nVidia GeForce GTX 670 67.87 100.00 %
More is better


Page 1 - Introduction Page 10 - DIRT Showdown
Page 2 - Test Setup Page 11 - Far Cry 3
Page 3 - 3DMark Fire Strike Page 12 - Sleeping Dogs
Page 4 - Unigine Heaven 4.0 Page 13 - The Elder Scrolls V: Skyrim
Page 5 - BattleField 3 Page 14 - Metro: Last Light
Page 6 - Borderlands 2 Page 15 - GTA V
Page 7 - Bioshock Infinite Page 16 - Power Consumption
Page 8 - Crysis 3 Page 17 - Performance Index, price
Page 9 - Call of Duty Black Ops 2 Page 18 - Conclusion
[pagebreak]

Crysis 3


High Preset, 1920x1080, 8xMSAA, Very High FPS Index
nVidia GeForce GTX 770 25.8 116.22 %
nVidia GeForce GTX 670 22.2 100.00 %
More is better


Page 1 - Introduction Page 10 - DIRT Showdown
Page 2 - Test Setup Page 11 - Far Cry 3
Page 3 - 3DMark Fire Strike Page 12 - Sleeping Dogs
Page 4 - Unigine Heaven 4.0 Page 13 - The Elder Scrolls V: Skyrim
Page 5 - BattleField 3 Page 14 - Metro: Last Light
Page 6 - Borderlands 2 Page 15 - GTA V
Page 7 - Bioshock Infinite Page 16 - Power Consumption
Page 8 - Crysis 3 Page 17 - Performance Index, price
Page 9 - Call of Duty Black Ops 2 Page 18 - Conclusion
[pagebreak]

Call of Duty Black Ops 2


High Preset, 1920x1080, 8xMSAA, High FPS Index
nVidia GeForce GTX 770 109.0 113.78 %
nVidia GeForce GTX 670 95.8 100.00 %
More is better


Page 1 - Introduction Page 10 - DIRT Showdown
Page 2 - Test Setup Page 11 - Far Cry 3
Page 3 - 3DMark Fire Strike Page 12 - Sleeping Dogs
Page 4 - Unigine Heaven 4.0 Page 13 - The Elder Scrolls V: Skyrim
Page 5 - BattleField 3 Page 14 - Metro: Last Light
Page 6 - Borderlands 2 Page 15 - GTA V
Page 7 - Bioshock Infinite Page 16 - Power Consumption
Page 8 - Crysis 3 Page 17 - Performance Index, price
Page 9 - Call of Duty Black Ops 2 Page 18 - Conclusion
[pagebreak]

DIRT Showdown - Benchmark


High Preset, 1920x1080, 8xMSAA, Ultra FPS Index
nVidia GeForce GTX 770 68.79 116.63 %
nVidia GeForce GTX 670 58.98 100.00 %
More is better


Page 1 - Introduction Page 10 - DIRT Showdown
Page 2 - Test Setup Page 11 - Far Cry 3
Page 3 - 3DMark Fire Strike Page 12 - Sleeping Dogs
Page 4 - Unigine Heaven 4.0 Page 13 - The Elder Scrolls V: Skyrim
Page 5 - BattleField 3 Page 14 - Metro: Last Light
Page 6 - Borderlands 2 Page 15 - GTA V
Page 7 - Bioshock Infinite Page 16 - Power Consumption
Page 8 - Crysis 3 Page 17 - Performance Index, price
Page 9 - Call of Duty Black Ops 2 Page 18 - Conclusion
[pagebreak]

Far Cry 3


High Preset, 1920x1080, 8xMSAA, Ultra FPS Index
nVidia GeForce GTX 770 38.2 118.63 %
nVidia GeForce GTX 670 32.2 100.00 %
More is better


Page 1 - Introduction Page 10 - DIRT Showdown
Page 2 - Test Setup Page 11 - Far Cry 3
Page 3 - 3DMark Fire Strike Page 12 - Sleeping Dogs
Page 4 - Unigine Heaven 4.0 Page 13 - The Elder Scrolls V: Skyrim
Page 5 - BattleField 3 Page 14 - Metro: Last Light
Page 6 - Borderlands 2 Page 15 - GTA V
Page 7 - Bioshock Infinite Page 16 - Power Consumption
Page 8 - Crysis 3 Page 17 - Performance Index, price
Page 9 - Call of Duty Black Ops 2 Page 18 - Conclusion
[pagebreak]

Sleeping Dogs - Benchmark


High Preset, 1920x1080, Extreme, High-Res Textures FPS Index
nVidia GeForce GTX 770 51.7 121.08 %
nVidia GeForce GTX 670 42.7 100.00 %
More is better


Page 1 - Introduction Page 10 - DIRT Showdown
Page 2 - Test Setup Page 11 - Far Cry 3
Page 3 - 3DMark Fire Strike Page 12 - Sleeping Dogs
Page 4 - Unigine Heaven 4.0 Page 13 - The Elder Scrolls V: Skyrim
Page 5 - BattleField 3 Page 14 - Metro: Last Light
Page 6 - Borderlands 2 Page 15 - GTA V
Page 7 - Bioshock Infinite Page 16 - Power Consumption
Page 8 - Crysis 3 Page 17 - Performance Index, price
Page 9 - Call of Duty Black Ops 2 Page 18 - Conclusion
[pagebreak]

The Elder Scrolls V: Skyrim


High Preset, 1920x1080, 8xAA, Ultra FPS Index
nVidia GeForce GTX 770 109.0 113.07 %
nVidia GeForce GTX 670 96.40 100.00 %
More is better


Page 1 - Introduction Page 10 - DIRT Showdown
Page 2 - Test Setup Page 11 - Far Cry 3
Page 3 - 3DMark Fire Strike Page 12 - Sleeping Dogs
Page 4 - Unigine Heaven 4.0 Page 13 - The Elder Scrolls V: Skyrim
Page 5 - BattleField 3 Page 14 - Metro: Last Light
Page 6 - Borderlands 2 Page 15 - GTA V
Page 7 - Bioshock Infinite Page 16 - Power Consumption
Page 8 - Crysis 3 Page 17 - Performance Index, price
Page 9 - Call of Duty Black Ops 2 Page 18 - Conclusion
[pagebreak]

Metro: Last Light - Benchmark


Very High, 1920x1080, SSAA, DX11 FPS Index
nVidia GeForce GTX 770 32.53 119.16 %
nVidia GeForce GTX 670 27.30 100.00 %
More is better


Page 1 - Introduction Page 10 - DIRT Showdown
Page 2 - Test Setup Page 11 - Far Cry 3
Page 3 - 3DMark Fire Strike Page 12 - Sleeping Dogs
Page 4 - Unigine Heaven 4.0 Page 13 - The Elder Scrolls V: Skyrim
Page 5 - BattleField 3 Page 14 - Metro: Last Light
Page 6 - Borderlands 2 Page 15 - GTA V
Page 7 - Bioshock Infinite Page 16 - Power Consumption
Page 8 - Crysis 3 Page 17 - Performance Index, price
Page 9 - Call of Duty Black Ops 2 Page 18 - Conclusion
[pagebreak]

Grand Theft Auto V


Page 1 - Introduction Page 10 - DIRT Showdown
Page 2 - Test Setup Page 11 - Far Cry 3
Page 3 - 3DMark Fire Strike Page 12 - Sleeping Dogs
Page 4 - Unigine Heaven 4.0 Page 13 - The Elder Scrolls V: Skyrim
Page 5 - BattleField 3 Page 14 - Metro: Last Light
Page 6 - Borderlands 2 Page 15 - GTA V
Page 7 - Bioshock Infinite Page 16 - Power Consumption
Page 8 - Crysis 3 Page 17 - Performance Index, price
Page 9 - Call of Duty Black Ops 2 Page 18 - Conclusion
[pagebreak]

Power Consumption


Power Consumption Idle* Watts Index
nVidia GeForce GTX 770 53 101.92 %
nVidia GeForce GTX 670 52 100.00 %
*Entire system Less is better


Power Consumption Load (FurMark)* Watts Index
nVidia GeForce GTX 770 257 113.22 %
nVidia GeForce GTX 670 227 100.00 %
*Entire system Less is better


Page 1 - Introduction Page 10 - DIRT Showdown
Page 2 - Test Setup Page 11 - Far Cry 3
Page 3 - 3DMark Fire Strike Page 12 - Sleeping Dogs
Page 4 - Unigine Heaven 4.0 Page 13 - The Elder Scrolls V: Skyrim
Page 5 - BattleField 3 Page 14 - Metro: Last Light
Page 6 - Borderlands 2 Page 15 - GTA V
Page 7 - Bioshock Infinite Page 16 - Power Consumption
Page 8 - Crysis 3 Page 17 - Performance Index, price
Page 9 - Call of Duty Black Ops 2 Page 18 - Conclusion
[pagebreak]

Performance Index, price

  Index
nVidia GeForce GTX 770 115.83 %
nVidia GeForce GTX 670 100.00 %
More is better


  Geizhals Toppreise
nVidia GeForce GTX 770 Toppreise.ch
nVidia GeForce GTX 670 Toppreise.ch


Page 1 - Introduction Page 10 - DIRT Showdown
Page 2 - Test Setup Page 11 - Far Cry 3
Page 3 - 3DMark Fire Strike Page 12 - Sleeping Dogs
Page 4 - Unigine Heaven 4.0 Page 13 - The Elder Scrolls V: Skyrim
Page 5 - BattleField 3 Page 14 - Metro: Last Light
Page 6 - Borderlands 2 Page 15 - GTA V
Page 7 - Bioshock Infinite Page 16 - Power Consumption
Page 8 - Crysis 3 Page 17 - Performance Index, price
Page 9 - Call of Duty Black Ops 2 Page 18 - Conclusion
[pagebreak]

Conclusion

Lets take a closer look at the results in the games we tested. In this case we can see, that the performance improvement from the GTX 670 to the GTX 770 varies between 7 (Borderlands 2) and 21 percent (Sleeping Dogs). Something that becomes very clear is that on average graphical intense titles benefit more from the GTX 770 than titles which are less demanding. Calculating the average in all games grants the GTX 770 an advantage of 16 percent over the GTX 670, which is quite something.

Things are starting to get a bit more interesting if we look at the framerates in absolute numbers. Since we mention average frames per seconds, this means that minimum framerates, can be up to 50 percent lower. If we now look at the games, where both cards score less than 60 fps, then 50 percent less would mean a minimum framerate of 30 fps, which comes dangerously close to stuttering. Since we have average frame rates as low as 30 fps here, it's to be expected, that the minimum framerate can dive below 20 fps, where we're definitely seeing stuttering.
It's these demanding games, where every additional frame makes a difference. But still a 16 percent improvement won't cut it, since the framerates will still be too low even with the GTX 770. So far we've only been talking about performance and we haven't spent one word on pricing, which is going to change now.

If you own a GTX 670 and you upgrade to a GTX 770, you will have to pay about 280 Euro for a 16 percent improvement. Should you really be willing to spend this kind of money just for replacing your "old" graphics card with the latest model, then you should definitely consider building an SLI. Adding another GTX 670 to your setup will give you a 40 to 80 percent performance boost and it will cost you quite a bit less. In other words the price performance ratio with adding a second GTX 670 is much better than with simply replacing the GTX 670 with a GTX 770. After checking eBay we found the prices for second hand GTX 670 cards starting at 200 US-Dollar in the US and 180 Euro in Germany. Unfortunately an SLI will also come with downsides. First of all the power consumption will go up, which also means, that the heat produced by the gaming rig will increase. In winter time this isn't an issue, but during summer, especially when you're living an a warmer country, an SLI might help to increase room temperature to a degree where it's not really comfortable anymore. Other than that you'll have to have a power supply, that can cope with two cards.

Nevertheless if it was our PC and our money and we wanted to get the highest framerates for the money, we would go for the SLI option, although power consumption will go up significantly.


Page 1 - Introduction Page 10 - DIRT Showdownn
Page 2 - Test Setup Page 11 - Far Cry 3
Page 3 - 3DMark Fire Strike Page 12 - Sleeping Dogs
Page 4 - Unigine Heaven 4.0 Page 13 - The Elder Scrolls V: Skyrim
Page 5 - BattleField 3 Page 14 - Metro: Last Light
Page 6 - Borderlands 2 Page 15 - GTA V
Page 7 - Bioshock Infinite Page 16 - Power Consumption
Page 8 - Crysis 3 Page 17 - Performance Index, price
Page 9 - Call of Duty Black Ops 2 Page 18 - Conclusion