ASUS GeForce GTX 650 Ti Boost DirectCU II OC Review + SLI
Category : NVIDIA
Published by Christian Ney on 25.04.13
 Like many other manufacturers ASUS released its very own version of the GTX 650 Ti Boost using a custom design PCB and a custom cooler. The latter is a smaller and cheaper version of the now well known DirectCU II, hopefully as good as the other ones from the series. The name says by itself, the card is shipped with a factory overclocking. In this case the GPU runs 52 MHz higher than the reference model.
 Article in English Article in English |
 Artikel in Deutsch Artikel in Deutsch |
 Article en français Article en français |
 Articolo in italiano Articolo in italiano |

On the following pages we will show you the strenghts and weaknesses of the ASUS GeForce GTX 650 Ti Boost DirectCU II OC.
Discuss this article in the forums [pagebreak]
Technical Data / Specifications
With the ASUS GeForce GTX 650 Ti Boost DirectCU II OC you get a factory overclocked card with a custom PCB cooled by a DirectCU II cooler. The ASIC quality measured on our sample was 71.7 % which is about average.
About ASIC quality:

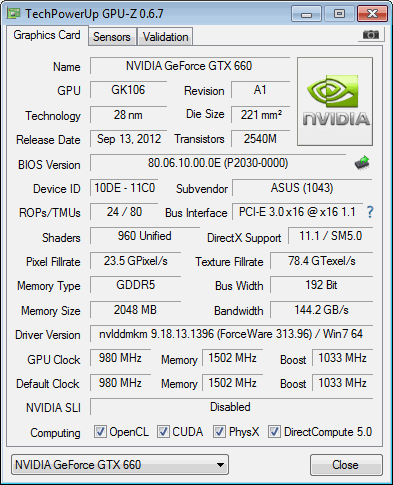
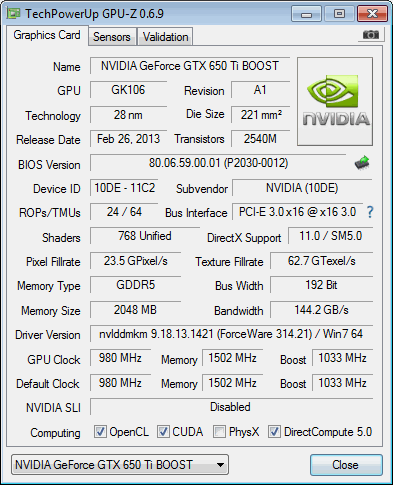
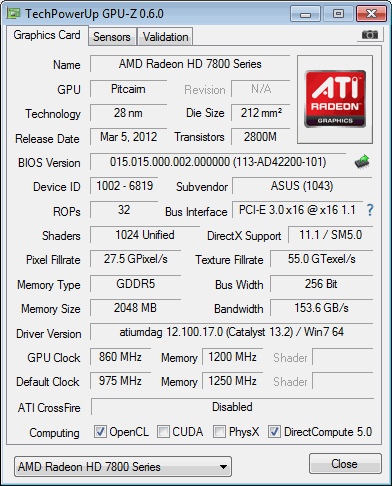
Looking at the clock speeds we see that the GPU runs at 1'020 MHz with a typical boost of 1'085 MHz, 52 MHz higher than the reference model. There are only three cards that feature higher clocks you can find in Europe. If you'd like to find them, check out our market overview: the SuperClocked from EVGA, the iChill HerculeZ 2000 from Inno3D and the OC from Gigabyte. Like most other manufacturers no factory overclocking has been made on the GDDR5 memory, therefore the clocks remain at 1'500 MHz (6'000 MHz effective) following nVidia's recommendations.

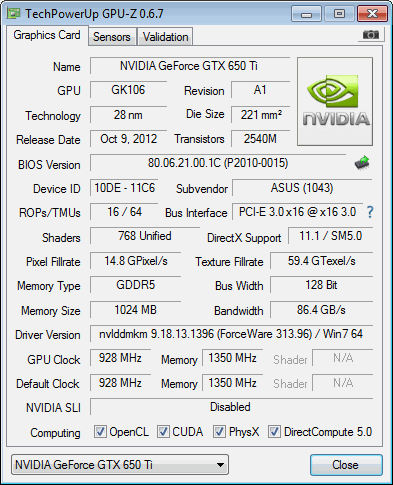
| nVidia GeForce | GTX 660 | ASUS GTX 650 Ti Boost DC2OC | GTX 650 Ti Boost | GTX 650 Ti |
| Chip | GK106 | GK106 | GK106 | GK106 |
| Process | 28 nm | 28 nm | 28 nm | 28 nm |
| Transistors | 2.54 Billion | 2.54 billion | 2.54 billion | 2.54 Billion |
| GPU clock | 980 MHz | 1'020 MHz | 980 MHz | 925 MHz |
| GPU Boost clock | 1'033 MHz | 1'085 MHz | 1'033 MHz | N/A |
| Memory | 2'048 MB GDDR5 | 2'048 MB GDDR5 | 2'048 MB GDDR5 | 2'048/1'024 MB GDDR5 |
| Memory clock | 1'500 MHz (6'000 MHz) | 1'500 MHz (6'000 MHz) | 1'500 MHz (6'000 MHz) | 1'350 MHz (5'400 MHz) |
| Memory interface | 192 Bit | 192 Bit | 192 Bit | 128 Bit |
| Memory bandwidth | 144'200 MB/s | 144'200 MB/s | 144'200 MB/s | 86'400 MB/s |
| TMUs | 80 | 64 | 64 | 64 |
| Shader Cores | 960 (5 SMX) | 768 (4 SMX) | 768 (4 SMX) | 768 (4 SMX) |
| ROPs | 24 ROP | 16 ROP | 16 ROP | 16 ROP |
| Maximum board power | 140 Watt | XXX Watt | 140 Watt | 110 Watt |
| PCB Type | Reference Design | Custom Design | Reference Design | Reference Design |
| Size (PCB - Total) | 17.2 - 24.0 cm | 19.0 - 21.2 cm | PCIe16x | |
| Cooler | Reference Design | DirectCU II | Reference Design | Reference Design |
| MSRP | $229 | $XXX | $169 | $149 |
As mentioned previously, this card from ASUS makes use of the custom PCB. ASUS engineers reworked the circuitry and the power design but didn't go too far. In this case you don't find a digital power design nor more phases. The only major changes apart from the PCB design itself are the use of super alloy components and different but still cost effective voltage controller. Therefore you get an analogue power design with five phases, where the GPU gets four phases and the memory gets one phase.
The voltage regulation chip used for the GPU is a RT8867A from Richtek Technology. On the memory power design side you find an APW7165A from ANPEC Electronics.

ASUS ships the GeForce GTX 650 Ti Boost with a smaller and cheaper version of the dual slot DirectCU II cooler. This one comes with two heatpipes, that feature 6 millimeter diameter. Both heatpipes establish direct contact via the direct touch technology. Furthermore there are two 75 millimeter fans and no aluminium fins. The latter explain itself when you look at the heatsink, which has been made from aluminium entirely. Very cheap but in our test it proved to be very good - so why not.
Although this cooler is a smaller version, it is longer than the card's PCB by 2.4cm lenghtwise, which ends up with a total card lenght of 21.50 centimeter. Also because of the two heatpipes the cooler is 0.8 centimeter higher.

The memory chips used are made by Hynix and carry the model number H5GQ2H24AFR-R0C. They are specified to run at 1'500 MHz (6'000 MHz effective).

Discuss this article in the forums [pagebreak]
Preview


Delivery


Bundled with the graphics card there is a documentation, a driver CD that includes the overclocking tool too, a power converter (2x Molex to PCIe-6pin) and a DVI to VGA adapter. That's about all you need with such a card.
The card ships well bolstered in a foam mold.
Discuss this article in the forums [pagebreak]
Test Setup
Hardware
| Mainboard |
|
| CPUs |
|
| Memory |
|
| Graphic Cards (Driver) |
|
| Drivers |
|
| Games and OS |
|
| HDD |
|
| PSU |
|


Discuss this article in the forums [pagebreak]
3DMark 11 Performance

| Graphics Cards | Score | Graphics Score |
| nVidia GeForce GTX 650 Ti Boost SLI | 10'011 | 10'698 |
| AMD Radeon HD 7790 CrossFire | 9'836 | 10'020 |
| nVidia GeForce GTX 660 Ti | 8'673 | 8'663 |
| AMD Radeon HD 7870 | 7'604 | 7'210 |
| nVidia GeForce GTX 660 | 6'854 | 6'624 |
| AMD Radeon HD 7850 | 6'276 | 5'776 |
| ASUS GeForce GTX 650 Ti Boost DC2 OC | 5'864 | 5'579 |
| nVidia GeForce GTX 650 Ti Boost | 5'831 | 5'523 |
| AMD Radeon HD 7790 | 5'818 | 5'360 |
| nVidia GeForce GTX 560 Ti 448C | 5'797 | 5'341 |
| nVidia GeForce GTX 650 Ti | 4'802 | 4'492 |
| nVidia GeForce GTX 470 | 4'888 | 4'435 |
| AMD Radeon HD 5870 | 4'723 | 4'307 |
| AMD Radeon HD 6870 | 4'521 | 4'107 |
| AMD Radeon HD 5850 | 3'995 | 3'592 |
| AMD Radeon HD 6850 | 3'767 | 3'368 |
| nVidia GeForce GTX 460 | 3'646 | 3'265 |
| More is better | ||

Discuss this article in the forums [pagebreak]
3DMark - Fire Strike Performance

| Graphics Cards | Score | Graphics Score |
| nVidia GeForce GTX 650 Ti Boost SLI | 6'176 | 7'187 |
| AMD Radeon HD 7790 CrossFire | 4'619 | 5'676 |
| nVidia GeForce GTX 660 Ti | 5'139 | 5'583 |
| AMD Radeon HD 7870 | 4'991 | 5'389 |
| nVidia GeForce GTX 660 | 4'408 | 4'695 |
| AMD Radeon HD 7850 | 4'168 | 4'439 |
| ASUS GeForce GTX 650 Ti Boost DC2 OC | 3'883 | 4'097 |
| nVidia GeForce GTX 560 Ti 448C | 3'699 | 4'071 |
| nVidia GeForce GTX 650 Ti Boost | 3'805 | 4'007 |
| AMD Radeon HD 7790 | 3'606 | 3'882 |
| AMD Radeon HD 5870 | 3'266 | 3'336 |
| AMD Radeon HD 6870 | 3'015 | 3'120 |
| nVidia GeForce GTX 650 Ti | 2'923 | 3'056 |
| nVidia GeForce GTX 470 | 2'474 | 2'828 |
| AMD Radeon HD 5850 | 2'734 | 2'775 |
| AMD Radeon HD 6850 | 2'475 | 2'559 |
| nVidia GeForce GTX 460 | 2'278 | 2'417 |
| More is better | ||

3DMark - Fire Strike Extreme

| Graphics Cards | Score | Graphics Score |
| nVidia GeForce GTX 650 Ti Boost SLI | 2'830 | 2'973 |
| nVidia GeForce GTX 660 Ti | 2'535 | 2'601 |
| AMD Radeon HD 7870 | 2'441 | 2'500 |
| nVidia GeForce GTX 660 | 2'166 | 2'185 |
| AMD Radeon HD 7850 | 2'038 | 2'056 |
| ASUS GeForce GTX 650 Ti Boost DC2 OC | 1'904 | 1'912 |
| nVidia GeForce GTX 650 Ti Boost | 1'863 | 1'868 |
| AMD Radeon HD 7790 CrossFire | 1'360 | 1'506 |
| AMD Radeon HD 7790 | 1'411 | 1'495 |
| nVidia GeForce GTX 560 Ti 448C | 1'199 | 1'127 |
| AMD Radeon HD 6870 | 1'071 | 1'055 |
| AMD Radeon HD 5870 | 1'067 | 1'027 |
| nVidia GeForce GTX 650 Ti | 846 | 910 |
| AMD Radeon HD 5850 | 925 | 874 |
| nVidia GeForce GTX 470 | 698 | 631 |
| AMD Radeon HD 6850 | 878 | 815 |
| nVidia GeForce GTX 460 | 550 | 488 |
| More is better | ||

Discuss this article in the forums [pagebreak]
Unigine Heaven 4.0 Extreme Preset

| Graphics Cards | Graphics Score | FPS |
| nVidia GeForce GTX 650 Ti Boost SLI | 1'310 | 54.8 |
| AMD Radeon HD 7790 CrossFire | 1'127 | 44.7 |
| nVidia GeForce GTX 660 Ti | 1'006 | 39.9 |
| nVidia GeForce GTX 660 | 872 | 34.6 |
| AMD Radeon HD 7870 | 826 | 32.8 |
| nVidia GeForce GTX 560 Ti 448C | 794 | 31.5 |
| ASUS GeForce GTX 650 Ti Boost DC2 OC | 717 | 28.5 |
| nVidia GeForce GTX 650 Ti Boost | 707 | 28.1 |
| AMD Radeon HD 7850 | 683 | 27.1 |
| nVidia GeForce GTX 470 | 627 | 24.9 |
| AMD Radeon HD 7790 | 567 | 22.5 |
| nVidia GeForce GTX 650 Ti | 527 | 20.9 |
| AMD Radeon HD 6870 | 505 | 20.0 |
| nVidia GeForce GTX 460 | 500 | 19.9 |
| AMD Radeon HD 5870 | 468 | 18.6 |
| AMD Radeon HD 6850 | 421 | 16.7 |
| AMD Radeon HD 5850 | 394 | 15.6 |
| More is better | ||
Discuss this article in the forums [pagebreak]
BattleField 3

| High Preset, 1980x1080, 4xMSAA, Ultra, SSAO | Average FPS |
| nVidia GeForce GTX 650 Ti Boost SLI | 87.8 |
| AMD Radeon HD 7790 CrossFire | 73.2 |
| nVidia GeForce GTX 660 Ti | 59.2 |
| AMD Radeon HD 7870 | 55.0 |
| nVidia GeForce GTX 660 | 52.0 |
| ASUS GeForce GTX 650 Ti Boost DC2 OC | 46.0 |
| nVidia GeForce GTX 650 Ti Boost | 45.4 |
| AMD Radeon HD 7850 | 44.2 |
| nVidia GeForce GTX 560 Ti 448C | 40.2 |
| AMD Radeon HD 7790 | 36.6 |
| nVidia GeForce GTX 470 | 33.6 |
| AMD Radeon HD 5870 | 32.6 |
| nVidia GeForce GTX 650 Ti | 31.6 |
| AMD Radeon HD 6870 | 30.4 |
| nVidia GeForce GTX 460 | 27.8 |
| AMD Radeon HD 5850 | 27.2 |
| AMD Radeon HD 6850 | 24.6 |
| More is better |

| Medium Preset, 1680x1050, 2xMSAA, High, SSAO | Average FPS |
| nVidia GeForce GTX 660 Ti | 89.4 |
| AMD Radeon HD 7870 | 80.2 |
| nVidia GeForce GTX 660 | 74.6 |
| AMD Radeon HD 7850 | 65.4 |
| ASUS GeForce GTX 650 Ti Boost DC2 OC | 65.0 |
| nVidia GeForce GTX 650 Ti Boost | 64.2 |
| nVidia GeForce GTX 560 Ti 448C | 54.8 |
| AMD Radeon HD 7790 | 54.8 |
| AMD Radeon HD 5870 | 47.8 |
| nVidia GeForce GTX 650 Ti | 46.8 |
| nVidia GeForce GTX 470 | 44.8 |
| AMD Radeon HD 6870 | 43.6 |
| AMD Radeon HD 5850 | 39.8 |
| nVidia GeForce GTX 460 | 37.6 |
| AMD Radeon HD 6850 | 36.8 |
| More is better |

Discuss this article in the forums [pagebreak]
Borderlands 2

| High Preset, 1980x1080, FXAA, no PhsyX, High | Average FPS |
| nVidia GeForce GTX 650 Ti Boost SLI | 132.6 |
| AMD Radeon HD 7790 CrossFire | 107.0 |
| nVidia GeForce GTX 660 Ti | 100.2 |
| nVidia GeForce GTX 660 | 88.4 |
| ASUS GeForce GTX 650 Ti Boost DC2 OC | 80.2 |
| nVidia GeForce GTX 650 Ti Boost | 79.6 |
| AMD Radeon HD 7870 | 76.4 |
| nVidia GeForce GTX 560 Ti 448C | 74.8 |
| AMD Radeon HD 7850 | 66.6 |
| AMD Radeon HD 5870 | 66.2 |
| nVidia GeForce GTX 470 | 59.2 |
| AMD Radeon HD 6870 | 57.8 |
| nVidia GeForce GTX 650 Ti | 55.2 |
| AMD Radeon HD 5850 | 54.8 |
| AMD Radeon HD 7790 | 54.4 |
| nVidia GeForce GTX 460 | 51.6 |
| AMD Radeon HD 6850 | 47.6 |
| More is better |


Discuss this article in the forums [pagebreak]
Bioshock Infinite

| Graphics Cards | FPS |
| nVidia GeForce GTX 650 Ti Boost SLI | 101.17 |
| AMD Radeon HD 6990 | 96.21 |
| nVidia GeForce GTX 680 | 98.45 |
| AMD Radeon HD 7970 GE | 95.26 |
| nVidia GeForce GTX 670 | 89.74 |
| AMD Radeon HD 7970 | 87.64 |
| nVidia GeForce GTX 660 Ti | 83.40 |
| nVidia GeForce GTX 660 | 66.85 |
| AMD Radeon HD 7870 | 64.96 |
| nVidia GeForce GTX 580 | 60.45 |
| ASUS GeForce GTX 650 Ti Boost DC2 OC | 58.96 |
| nVidia GeForce GTX 650 Ti Boost | 57.89 |
| AMD Radeon HD 7850 | 53.35 |
| AMD Radeon HD 6970 | 53.17 |
| nVidia GeForce GTX 560 Ti 448C | 50.34 |
| AMD Radeon HD 5870 | 48.82 |
| AMD Radeon HD 6950 | 46.96 |
| AMD Radeon HD 7790 | 44.78 |
| nVidia GeForce GTX 650 Ti | 44.40 |
| AMD Radeon HD 6870 | 41.23 |
| nVidia GeForce GTX 470 | 41.17 |
| AMD Radeon HD 5850 | 40.01 |
| nVidia GeForce GTX 460 | 34.91 |
| AMD Radeon HD 6850 | 33.56 |
| nVidia GeForce GTX 465 | 32.97 |
| nVidia GeForce GTX 550 Ti | 27.18 |
| More is better |

Discuss this article in the forums [pagebreak]
Crysis 3

| High Preset, 1980x1080, 8xMSAA, Very High | Average FPS |
| nVidia GeForce GTX 650 Ti Boost SLI | 26.0 |
| nVidia GeForce GTX 660 Ti | 18.6 |
| nVidia GeForce GTX 660 | 16.6 |
| ASUS GeForce GTX 650 Ti Boost DC2 OC | 14.6 |
| nVidia GeForce GTX 650 Ti Boost | 14.6 |
| AMD Radeon HD 7870 | 13.6 |
| nVidia GeForce GTX 560 Ti 448C | 12.8 |
| AMD Radeon HD 7850 | 11.4 |
| nVidia GeForce GTX 470 | 10.2 |
| nVidia GeForce GTX 650 Ti | 10.2 |
| nVidia GeForce GTX 460 | 9.0 |
| AMD Radeon HD 5870 | 9.0 |
| AMD Radeon HD 5850 | 7.6 |
| AMD Radeon HD 7790 | 7.4 |
| AMD Radeon HD 6850 | 7.2 |
| AMD Radeon HD 6870 | 6.6 |
| AMD Radeon HD 7790 CrossFire | 5.8 |
| More is better |


| Medium Preset, 1680x1050, 2xMSAA, Medium | Average FPS |
| nVidia GeForce GTX 660 Ti | 61.8 |
| nVidia GeForce GTX 660 | 54.4 |
| AMD Radeon HD 7870 | 52.4 |
| nVidia GeForce GTX 560 Ti 448C | 49.6 |
| ASUS GeForce GTX 650 Ti Boost DC2 OC | 49.4 |
| nVidia GeForce GTX 650 Ti Boost | 48.8 |
| AMD Radeon HD 7850 | 45.2 |
| nVidia GeForce GTX 470 | 39.6 |
| AMD Radeon HD 6870 | 37.2 |
| nVidia GeForce GTX 650 Ti | 36.6 |
| AMD Radeon HD 5870 | 35.6 |
| AMD Radeon HD 7790 | 33.6 |
| nVidia GeForce GTX 460 | 33.0 |
| AMD Radeon HD 6850 | 31.2 |
| AMD Radeon HD 5850 | 30.0 |
| More is better |


Discuss this article in the forums [pagebreak]
Call of Duty Black Ops 2

| High Preset, 1980x1080, 8xMSAA, High | Average FPS |
| nVidia GeForce GTX 650 Ti Boost SLI | 123.0 |
| AMD Radeon HD 7790 CrossFire | 89.8 |
| nVidia GeForce GTX 660 Ti | 88.8 |
| AMD Radeon HD 7870 | 76.4 |
| nVidia GeForce GTX 660 | 73.0 |
| AMD Radeon HD 7850 | 67.6 |
| ASUS GeForce GTX 650 Ti Boost DC2 OC | 66.8 |
| nVidia GeForce GTX 560 Ti 448C | 65.4 |
| nVidia GeForce GTX 650 Ti Boost | 63.8 |
| AMD Radeon HD 5870 | 63.2 |
| AMD Radeon HD 6870 | 57.0 |
| nVidia GeForce GTX 470 | 54.2 |
| AMD Radeon HD 5850 | 53.2 |
| AMD Radeon HD 6850 | 49.0 |
| nVidia GeForce GTX 650 Ti | 47.2 |
| AMD Radeon HD 7790 | 45.0 |
| nVidia GeForce GTX 460 | 41.0 |
| More is better |

Discuss this article in the forums [pagebreak]
DIRT Showdown - Benchmark

| High Preset, 1980x1080, 8xMSAA, Ultra | Average FPS |
| AMD Radeon HD 7790 CrossFire | 83.84 |
| nVidia GeForce GTX 650 Ti Boost SLI | 64.43 |
| AMD Radeon HD 7870 | 63.58 |
| nVidia GeForce GTX 660 Ti | 55.23 |
| AMD Radeon HD 7850 | 50.74 |
| AMD Radeon HD 7790 | 45.71 |
| nVidia GeForce GTX 660 | 44.53 |
| nVidia GeForce GTX 560 Ti 448C | 41.28 |
| ASUS GeForce GTX 650 Ti Boost DC2 OC | 37.99 |
| nVidia GeForce GTX 650 Ti Boost | 37.13 |
| AMD Radeon HD 5870 | 35.56 |
| nVidia GeForce GTX 470 | 32.03 |
| AMD Radeon HD 6870 | 30.21 |
| AMD Radeon HD 5850 | 29.6 |
| nVidia GeForce GTX 650 Ti | 28.88 |
| nVidia GeForce GTX 460 | 24.73 |
| AMD Radeon HD 6850 | 24.25 |
| More is better |


| Medium Preset, 1680x1050, 2xMSAA, High | Average FPS |
| nVidia GeForce GTX 660 Ti | 137.02 |
| AMD Radeon HD 7870 | 131.89 |
| nVidia GeForce GTX 660 | 131.25 |
| AMD Radeon HD 7850 | 125.23 |
| nVidia GeForce GTX 560 Ti 448C | 124.13 |
| ASUS GeForce GTX 650 Ti Boost DC2 OC | 125.75 |
| nVidia GeForce GTX 650 Ti Boost | 124.09 |
| AMD Radeon HD 7790 | 112.58 |
| AMD Radeon HD 5870 | 111.18 |
| nVidia GeForce GTX 650 Ti | 104.13 |
| AMD Radeon HD 6870 | 98.80 |
| nVidia GeForce GTX 470 | 95.85 |
| AMD Radeon HD 5850 | 94.15 |
| nVidia GeForce GTX 460 | 85.29 |
| AMD Radeon HD 6850 | 83.32 |
| More is better |


Discuss this article in the forums [pagebreak]
Far Cry 3
| High Preset, 1980x1080, 8xMSAA, Ultra | Average FPS |
| nVidia GeForce GTX 650 Ti Boost SLI | 41.8 |
| nVidia GeForce GTX 660 Ti | 28.0 |
| AMD Radeon HD 7870 | 24.2 |
| nVidia GeForce GTX 660 | 23.8 |
| nVidia GeForce GTX 560 Ti 448C | 21.6 |
| ASUS GeForce GTX 650 Ti Boost DC2 OC | 21.4 |
| nVidia GeForce GTX 650 Ti Boost | 21.0 |
| AMD Radeon HD 5870 | 20.8 |
| AMD Radeon HD 7850 | 19.2 |
| nVidia GeForce GTX 470 | 16.8 |
| AMD Radeon HD 7790 CrossFire | 16.0 |
| AMD Radeon HD 5850 | 16.0 |
| AMD Radeon HD 6870 | 15.0 |
| nVidia GeForce GTX 650 Ti | 14.4 |
| nVidia GeForce GTX 460 | 12.8 |
| AMD Radeon HD 6850 | 11.6 |
| AMD Radeon HD 7790 | 8.6 |
| More is better |

| Medium Preset, 1680x1050, 2xMSAA, High | Average FPS |
| nVidia GeForce GTX 660 Ti | 79.0 |
| AMD Radeon HD 7870 | 65.8 |
| nVidia GeForce GTX 660 | 64.4 |
| nVidia GeForce GTX 560 Ti 448C | 58.2 |
| ASUS GeForce GTX 650 Ti Boost DC2 OC | 55.0 |
| nVidia GeForce GTX 650 Ti Boost | 54.0 |
| AMD Radeon HD 7850 | 53.8 |
| AMD Radeon HD 5870 | 50.0 |
| nVidia GeForce GTX 470 | 47.2 |
| AMD Radeon HD 6870 | 46.0 |
| AMD Radeon HD 7790 | 41.6 |
| AMD Radeon HD 5850 | 41.6 |
| nVidia GeForce GTX 650 Ti | 40.2 |
| AMD Radeon HD 6850 | 37.4 |
| nVidia GeForce GTX 460 | 34.8 |
| More is better |

Discuss this article in the forums [pagebreak]
Max Payne 3

| High Preset, 1980x1080, 8xMSAA, Very High | Average FPS |
| nVidia GeForce GTX 650 Ti Boost SLI | 44.4 |
| nVidia GeForce GTX 660 Ti | 29.0 |
| AMD Radeon HD 7870 | 29.0 |
| AMD Radeon HD 7790 CrossFire | 27.2 |
| nVidia GeForce GTX 560 Ti 448C | 26.8 |
| AMD Radeon HD 7850 | 25.0 |
| nVidia GeForce GTX 660 | 24.8 |
| ASUS GeForce GTX 650 Ti Boost DC2 OC | 22.8 |
| AMD Radeon HD 6870 | 22.4 |
| nVidia GeForce GTX 650 Ti Boost | 22.4 |
| nVidia GeForce GTX 470 | 22.0 |
| AMD Radeon HD 5870 | 20.6 |
| AMD Radeon HD 6850 | 18.0 |
| AMD Radeon HD 5850 | 17.2 |
| nVidia GeForce GTX 460 | 16.4 |
| AMD Radeon HD 7790 | 16.0 |
| nVidia GeForce GTX 650 Ti | 15.4 |
| More is better |

| Medium Preset, 1680x1050, 2xMSAA, High | Average FPS |
| AMD Radeon HD 7870 | 94.6 |
| nVidia GeForce GTX 660 Ti | 92.4 |
| nVidia GeForce GTX 560 Ti 448C | 84.4 |
| AMD Radeon HD 7850 | 82.8 |
| nVidia GeForce GTX 660 | 79.8 |
| ASUS GeForce GTX 650 Ti Boost DC2 OC | 75.6 |
| nVidia GeForce GTX 650 Ti Boost | 72.6 |
| nVidia GeForce GTX 470 | 67.6 |
| AMD Radeon HD 7790 | 63.6 |
| AMD Radeon HD 5870 | 63.4 |
| AMD Radeon HD 6870 | 63.2 |
| AMD Radeon HD 5850 | 54.4 |
| nVidia GeForce GTX 460 | 53.2 |
| AMD Radeon HD 6850 | 53.0 |
| nVidia GeForce GTX 650 Ti | 49.4 |
| More is better |

Discuss this article in the forums [pagebreak]
Sleeping Dogs - Benchmark

| High Preset, 1980x1080, Extreme, High-Res Textures | Average FPS |
| nVidia GeForce GTX 650 Ti Boost SLI | 48.5 |
| AMD Radeon HD 7790 CrossFire | 44.9 |
| nVidia GeForce GTX 660 Ti | 37.5 |
| AMD Radeon HD 7870 | 33.9 |
| nVidia GeForce GTX 660 | 29.4 |
| AMD Radeon HD 7850 | 27.7 |
| AMD Radeon HD 5870 | 27.4 |
| nVidia GeForce GTX 560 Ti 448C | 25.7 |
| ASUS GeForce GTX 650 Ti Boost DC2 OC | 25.0 |
| nVidia GeForce GTX 650 Ti Boost | 24.3 |
| AMD Radeon HD 6870 | 23.0 |
| AMD Radeon HD 7790 | 22.5 |
| AMD Radeon HD 5850 | 22.3 |
| nVidia GeForce GTX 470 | 19.8 |
| AMD Radeon HD 6850 | 18.5 |
| nVidia GeForce GTX 650 Ti | 18.0 |
| nVidia GeForce GTX 460 | 15.1 |
| More is better |

| Medium Preset, 1680x1050, High | Average FPS |
| nVidia GeForce GTX 660 Ti | 84.7 |
| AMD Radeon HD 7870 | 76.7 |
| nVidia GeForce GTX 660 | 67.6 |
| AMD Radeon HD 7850 | 61.8 |
| nVidia GeForce GTX 560 Ti 448C | 60.2 |
| ASUS GeForce GTX 650 Ti Boost DC2 OC | 58.8 |
| nVidia GeForce GTX 650 Ti Boost | 57.1 |
| AMD Radeon HD 5870 | 56.8 |
| AMD Radeon HD 7790 | 51.6 |
| AMD Radeon HD 6870 | 49.6 |
| nVidia GeForce GTX 470 | 47.6 |
| AMD Radeon HD 5850 | 47.2 |
| nVidia GeForce GTX 650 Ti | 43.4 |
| AMD Radeon HD 6850 | 40.7 |
| nVidia GeForce GTX 460 | 37.7 |
| More is better |

Discuss this article in the forums [pagebreak]
The Elder Scrolls V: Skyrim

| High Preset, 1980x1080, 8xAA, Ultra | Average FPS |
| nVidia GeForce GTX 650 Ti Boost SLI | 122.2 |
| AMD Radeon HD 7790 CrossFire | 111.8 |
| nVidia GeForce GTX 660 Ti | 87.8 |
| AMD Radeon HD 7870 | 86.0 |
| nVidia GeForce GTX 660 | 75.4 |
| nVidia GeForce GTX 560 Ti 448C | 70.2 |
| AMD Radeon HD 7850 | 71.2 |
| ASUS GeForce GTX 650 Ti Boost DC2 OC | 66.8 |
| nVidia GeForce GTX 650 Ti Boost | 66.0 |
| nVidia GeForce GTX 470 | 58.8 |
| AMD Radeon HD 5870 | 57.4 |
| AMD Radeon HD 7790 | 56.6 |
| AMD Radeon HD 6870 | 52.0 |
| AMD Radeon HD 5850 | 48.2 |
| nVidia GeForce GTX 650 Ti | 48.2 |
| nVidia GeForce GTX 460 | 45.6 |
| AMD Radeon HD 6850 | 44.0 |
| More is better |

Discuss this article in the forums [pagebreak]
The Witcher 2: Assassins of Kings Enhanced Edition

| High Preset, 1980x1080, Ultra | Average FPS |
| nVidia GeForce GTX 650 Ti Boost SLI | 33.8 |
| AMD Radeon HD 7790 CrossFire | 31.2 |
| AMD Radeon HD 7870 | 26.8 |
| nVidia GeForce GTX 660 Ti | 25.2 |
| AMD Radeon HD 7850 | 22.6 |
| nVidia GeForce GTX 560 Ti 448C | 22.0 |
| AMD Radeon HD 5870 | 21.2 |
| nVidia GeForce GTX 660 | 20.2 |
| AMD Radeon HD 6870 | 19.0 |
| nVidia GeForce GTX 470 | 18.2 |
| AMD Radeon HD 7790 | 18.0 |
| ASUS GeForce GTX 650 Ti Boost DC2 OC | 17.8 |
| nVidia GeForce GTX 650 Ti Boost | 17.4 |
| AMD Radeon HD 5850 | 17.4 |
| AMD Radeon HD 6850 | 15.8 |
| nVidia GeForce GTX 650 Ti | 13.2 |
| nVidia GeForce GTX 460 | 13.0 |
| More is better |

| Medium Preset, 1680x1050, High | Average FPS |
| nVidia GeForce GTX 660 Ti | 88.2 |
| AMD Radeon HD 7870 | 86.0 |
| nVidia GeForce GTX 560 Ti 448C | 79.0 |
| nVidia GeForce GTX 660 | 70.4 |
| AMD Radeon HD 7850 | 69.6 |
| ASUS GeForce GTX 650 Ti Boost DC2 OC | 62.4 |
| AMD Radeon HD 5870 | 60.6 |
| nVidia GeForce GTX 650 Ti Boost | 60.2 |
| AMD Radeon HD 6870 | 59.6 |
| AMD Radeon HD 7790 | 57.8 |
| nVidia GeForce GTX 470 | 56.2 |
| AMD Radeon HD 5850 | 54.8 |
| nVidia GeForce GTX 460 | 46.8 |
| nVidia GeForce GTX 650 Ti | 46.4 |
| AMD Radeon HD 6850 | 44.0 |
| More is better |

Discuss this article in the forums [pagebreak]
Power Consumption

| Power Consumption Idle* | Watts |
| nVidia GeForce GTX 560 Ti 448C (non ref design) | 70 |
| nVidia GeForce GTX 470 | 68 |
| AMD Radeon HD 5850 | 61 |
| AMD Radeon HD 6870 | 60 |
| AMD Radeon HD 6850 (non ref design) | 59 |
| AMD Radeon HD 5870 | 59 |
| nVidia GeForce GTX 660 Ti (non ref design) | 59 |
| nVidia GeForce GTX 660 (non ref design) | 56 |
| nVidia GeForce GTX 650 Ti Boost SLI (ref + non ref design) | 54 |
| nVidia GeForce GTX 460 (non ref design) | 54 |
| AMD Radeon HD 7870 (non ref design) | 53 |
| AMD Radeon HD 7790 CrossFire | 51 |
| AMD Radeon HD 7790 | 51 |
| nVidia GeForce GTX 650 Ti Boost | 51 |
| ASUS GeForce GTX 650 Ti Boost DC2 OC | 50 |
| nVidia GeForce GTX 650 Ti (non ref design) | 50 |
| AMD Radeon HD 7850 (non ref design) | 50 |
| *Entire system | Less is better |
| Power Consumption Load (FurMark)* | Watts |
| nVidia GeForce GTX 650 Ti Boost SLI (ref + non ref design) | 286 |
| nVidia GeForce GTX 560 Ti 448C (non ref design) | 250 |
| nVidia GeForce GTX 470 | 247 |
| nVidia GeForce GTX 460 (non ref design) | 199 |
| nVidia GeForce GTX 660 Ti (non ref design) | 195 |
| AMD Radeon HD 5870 | 193 |
| nVidia GeForce GTX 650 Ti Boost | 184 |
| AMD Radeon HD 7870 (non ref design) | 178 |
| AMD Radeon HD 6870 | 175 |
| nVidia GeForce GTX 660 (non ref design) | 173 |
| AMD Radeon HD 7790 CrossFire | 172 |
| ASUS GeForce GTX 650 Ti Boost DC2 OC | 171 |
| AMD Radeon HD 5850 | 170 |
| AMD Radeon HD 7850 (non ref design) | 166 |
| AMD Radeon HD 6850 (non ref design) | 161 |
| nVidia GeForce GTX 650 Ti (non ref design) | 130 |
| AMD Radeon HD 7790 | 103 |
| *Entire system | Less is better |
| Difference Idle/Load | Watts |
| nVidia GeForce GTX 650 Ti Boost SLI (ref + non ref design) | 232 |
| nVidia GeForce GTX 560 Ti 448C (non ref design) | 180 |
| nVidia GeForce GTX 470 | 179 |
| nVidia GeForce GTX 460 (non ref design) | 145 |
| nVidia GeForce GTX 660 Ti (non ref design) | 136 |
| AMD Radeon HD 5870 | 134 |
| nVidia GeForce GTX 650 Ti Boost | 133 |
| AMD Radeon HD 7870 (non ref design) | 125 |
| AMD Radeon HD 7790 CrossFire | 121 |
| ASUS GeForce GTX 650 Ti Boost DC2 OC | 121 |
| nVidia GeForce GTX 660 (non ref design) | 117 |
| AMD Radeon HD 7850 (non ref design) | 116 |
| AMD Radeon HD 6870 | 115 |
| AMD Radeon HD 5850 | 109 |
| AMD Radeon HD 6850 (non ref design) | 102 |
| nVidia GeForce GTX 650 Ti (non ref design) | 80 |
| AMD Radeon HD 7790 | 52 |
| More is better |

Discuss this article in the forums [pagebreak]
Fan Speed / Noise Level
Fan Speed

Noise Level

For the noise level results, we measured the noise level using a decibel meter (Voltcraft SL-200) located at 1 meter away from the graphics card.
Discuss this article in the forums [pagebreak]
Idle / FurMark / BF3
Idle Temperature

Idle, temperature is taken after 15 minutes @ 30 %, 50 % and 100 % fan speed.
Room Temperature: 25°C
Temperature under Furmark

For FurMark, temperature is taken after 15 minutes of GPU Burn test @ 30 %, 50 % and 100 % fan speed.
We stopped the test when the GPU temperature hit 90°C.
Room Temperature: 25°C
Temperature and fan speed under BattleField 3

For BattleField 3, temperature and fan speed values taken, are the highest achieved after 1 hour gaming @ auto fan speed.
Discuss this article in the forums [pagebreak]
Performance/Watt
| Graphics Cards | Performance Index | Power C. (Watts)* | Performance/Watt*10 |
| AMD Radeon HD 7790 CrossFire | 59.95 | 172 | 3.49 |
| AMD Radeon HD 7790 | 31.04 | 103 | 3.01 |
| AMD Radeon HD 7870 (non ref design) | 48.53 | 178 | 2.73 |
| nVidia GeForce GTX 660 Ti (non ref design) | 52.95 | 195 | 2.72 |
| nVidia GeForce GTX 660 (non ref design) | 44.81 | 173 | 2.59 |
| nVidia GeForce GTX 650 Ti Boost SLI (ref + non ref design) | 72.35 | 286 | 2.53 |
| AMD Radeon HD 7850 (non ref design) | 40.62 | 166 | 2.45 |
| ASUS GeForce GTX 650 Ti Boost DC2 OC | 39.94 | 171 | 2.34 |
| nVidia GeForce GTX 650 Ti (non ref design) | 28.23 | 130 | 2.17 |
| nVidia GeForce GTX 650 Ti Boost | 39.16 | 184 | 2.13 |
| AMD Radeon HD 5870 | 35.40 | 193 | 1.83 |
| AMD Radeon HD 6870 | 31.34 | 175 | 1.79 |
| AMD Radeon HD 5850 | 29.35 | 170 | 1.73 |
| AMD Radeon HD 6850 (non ref design) | 26.06 | 161 | 1.62 |
| nVidia GeForce GTX 560 Ti 448C (non ref design) | 40.08 | 250 | 1.60 |
| nVidia GeForce GTX 470 | 32.48 | 247 | 1.32 |
| nVidia GeForce GTX 460 (non ref design) | 25.70 | 199 | 1.29 |
| *Entire system | More is better | Less is better | More is better |
The "Performance Index" value is calculated as the sum of all benchmarks results divided by the amount of games (3DMark and Ungine not included into the calculation).
Performance/Price
| Graphics Cards | Performance Index | Price (€) | Performance/€*10 |
| AMD Radeon HD 6870 | 31.34 | 99.00 | 3.17 |
| AMD Radeon HD 7870 | 48.53 | 170.90 | 2.84 |
| nVidia GeForce GTX 660 | 44.81 | 161.50 | 2.77 |
| AMD Radeon HD 6850 | 26.06 | 92.77 | 2.81 |
| AMD Radeon HD 7790 | 31.04 | 113.63 | 2.73 |
| nVidia GeForce GTX 650 Ti 2GB | 28.23 | 104.38 | 2.70 |
| AMD Radeon HD 7850 2GB | 40.62 | 151.44 | 2.68 |
| nVidia GeForce GTX 650 Ti Boost 2GB | 39.16 | 145.52 | 2.69 |
| AMD Radeon HD 7790 CrossFire | 59.95 | 227.26 | 2.64 |
| nVidia GeForce GTX 460 | 25.70 | 102.29 | 2.51 |
| nVidia GeForce GTX 650 Ti Boost SLI | 72.35 | 291.04 | 2.49 |
| ASUS GeForce GTX 650 Ti Boost DC2 OC | 39.94 | 160.77 | 2.48 |
| nVidia GeForce GTX 660 Ti | 52.95 | 229.00 | 2.31 |
| AMD Radeon HD 5870 | 35.40 | 161.67 | 2.19 |
| AMD Radeon HD 5850 | 29.35 | 140.69 | 2.09 |
| nVidia GeForce GTX 470 | 32.48 | 196.6 | 1.65 |
| More is better | Less is better | More is better |
For the price we took the lowest price available on geizhals.eu, on the day the review has been published.
Discuss this article in the forums [pagebreak]
Conclusion
| General | + | - | |
| This GeForce GTX 650 Ti Boost DirectCU II OC from ASUS has
been able to convince us. The cooler is really good and able to keep the card cool and noiseless
being in idle or under heavy 3D load and we also like its design.
Furthermore it's
one of the
highest clocked GeForce GTX 650 Ti Boost around. Meanwhile we think the card is a bit too expensive although you get a very good cooler and high factory overclocking. You can find it for 15 Euro more than the cheapest GeForce GTX 650 Ti Boost and if you look at geizhals.at, it's the most expensive Ti Boost. In thise case ASUS could have done a factory overclocking on the memory and used a better quality heatsink. |
- Noiseless in both 2D & 3D
- Bundle - Design - Factory Overclocking |
- Price
- Cheap heatsink - No factory overclocking on the memory |
|
| Performance | + | - | |
| Thanks to the factory overclocking, the DirectCU II
OC is about 3.0 % faster on average in games than the same card with reference clocks. The power consumption in idle is the same as the reference card from nVidia. Our entire setup was drawing no more than 50 Watts. Under load we measured "only" 171 Watts. That's 13 Watts less than the reference card, which ticks 52 MHz lower. The difference lies with the custom PCB and the use of better power components. In the end the DirectCU II OC benefits of a much better Performance/Watt ratio and a lower Performance/Price ratio. |
- Performance/Watt
- Power Consumption in idle - Power Consumption under load |
||
| Recommendation | + | - | |
| This DirectCU II OC variant offers exactly what you would expect from a GeForce GTX 650 Ti Boost. It features a noiseless and powerful cooler as well as a custom design that makes the power consumption go down. The only contra we found it is the price which is in our opinion 5 € too much. | - Mid-Range Gaming | ||
| We gave the GeForce GTX 650 Ti Boost DirectCU II OC from ASUS the almost perfect award of 4 out of 5 stars. | |||

Discuss this article in the forums
Author: Christian Ney c.ney@ocaholic.ch